
Cash, Balance Sheet & Inventory
Bridge profit to cash, track receivables, payables and inventory, and reconcile the balance sheet.
The report as it appears in Excel
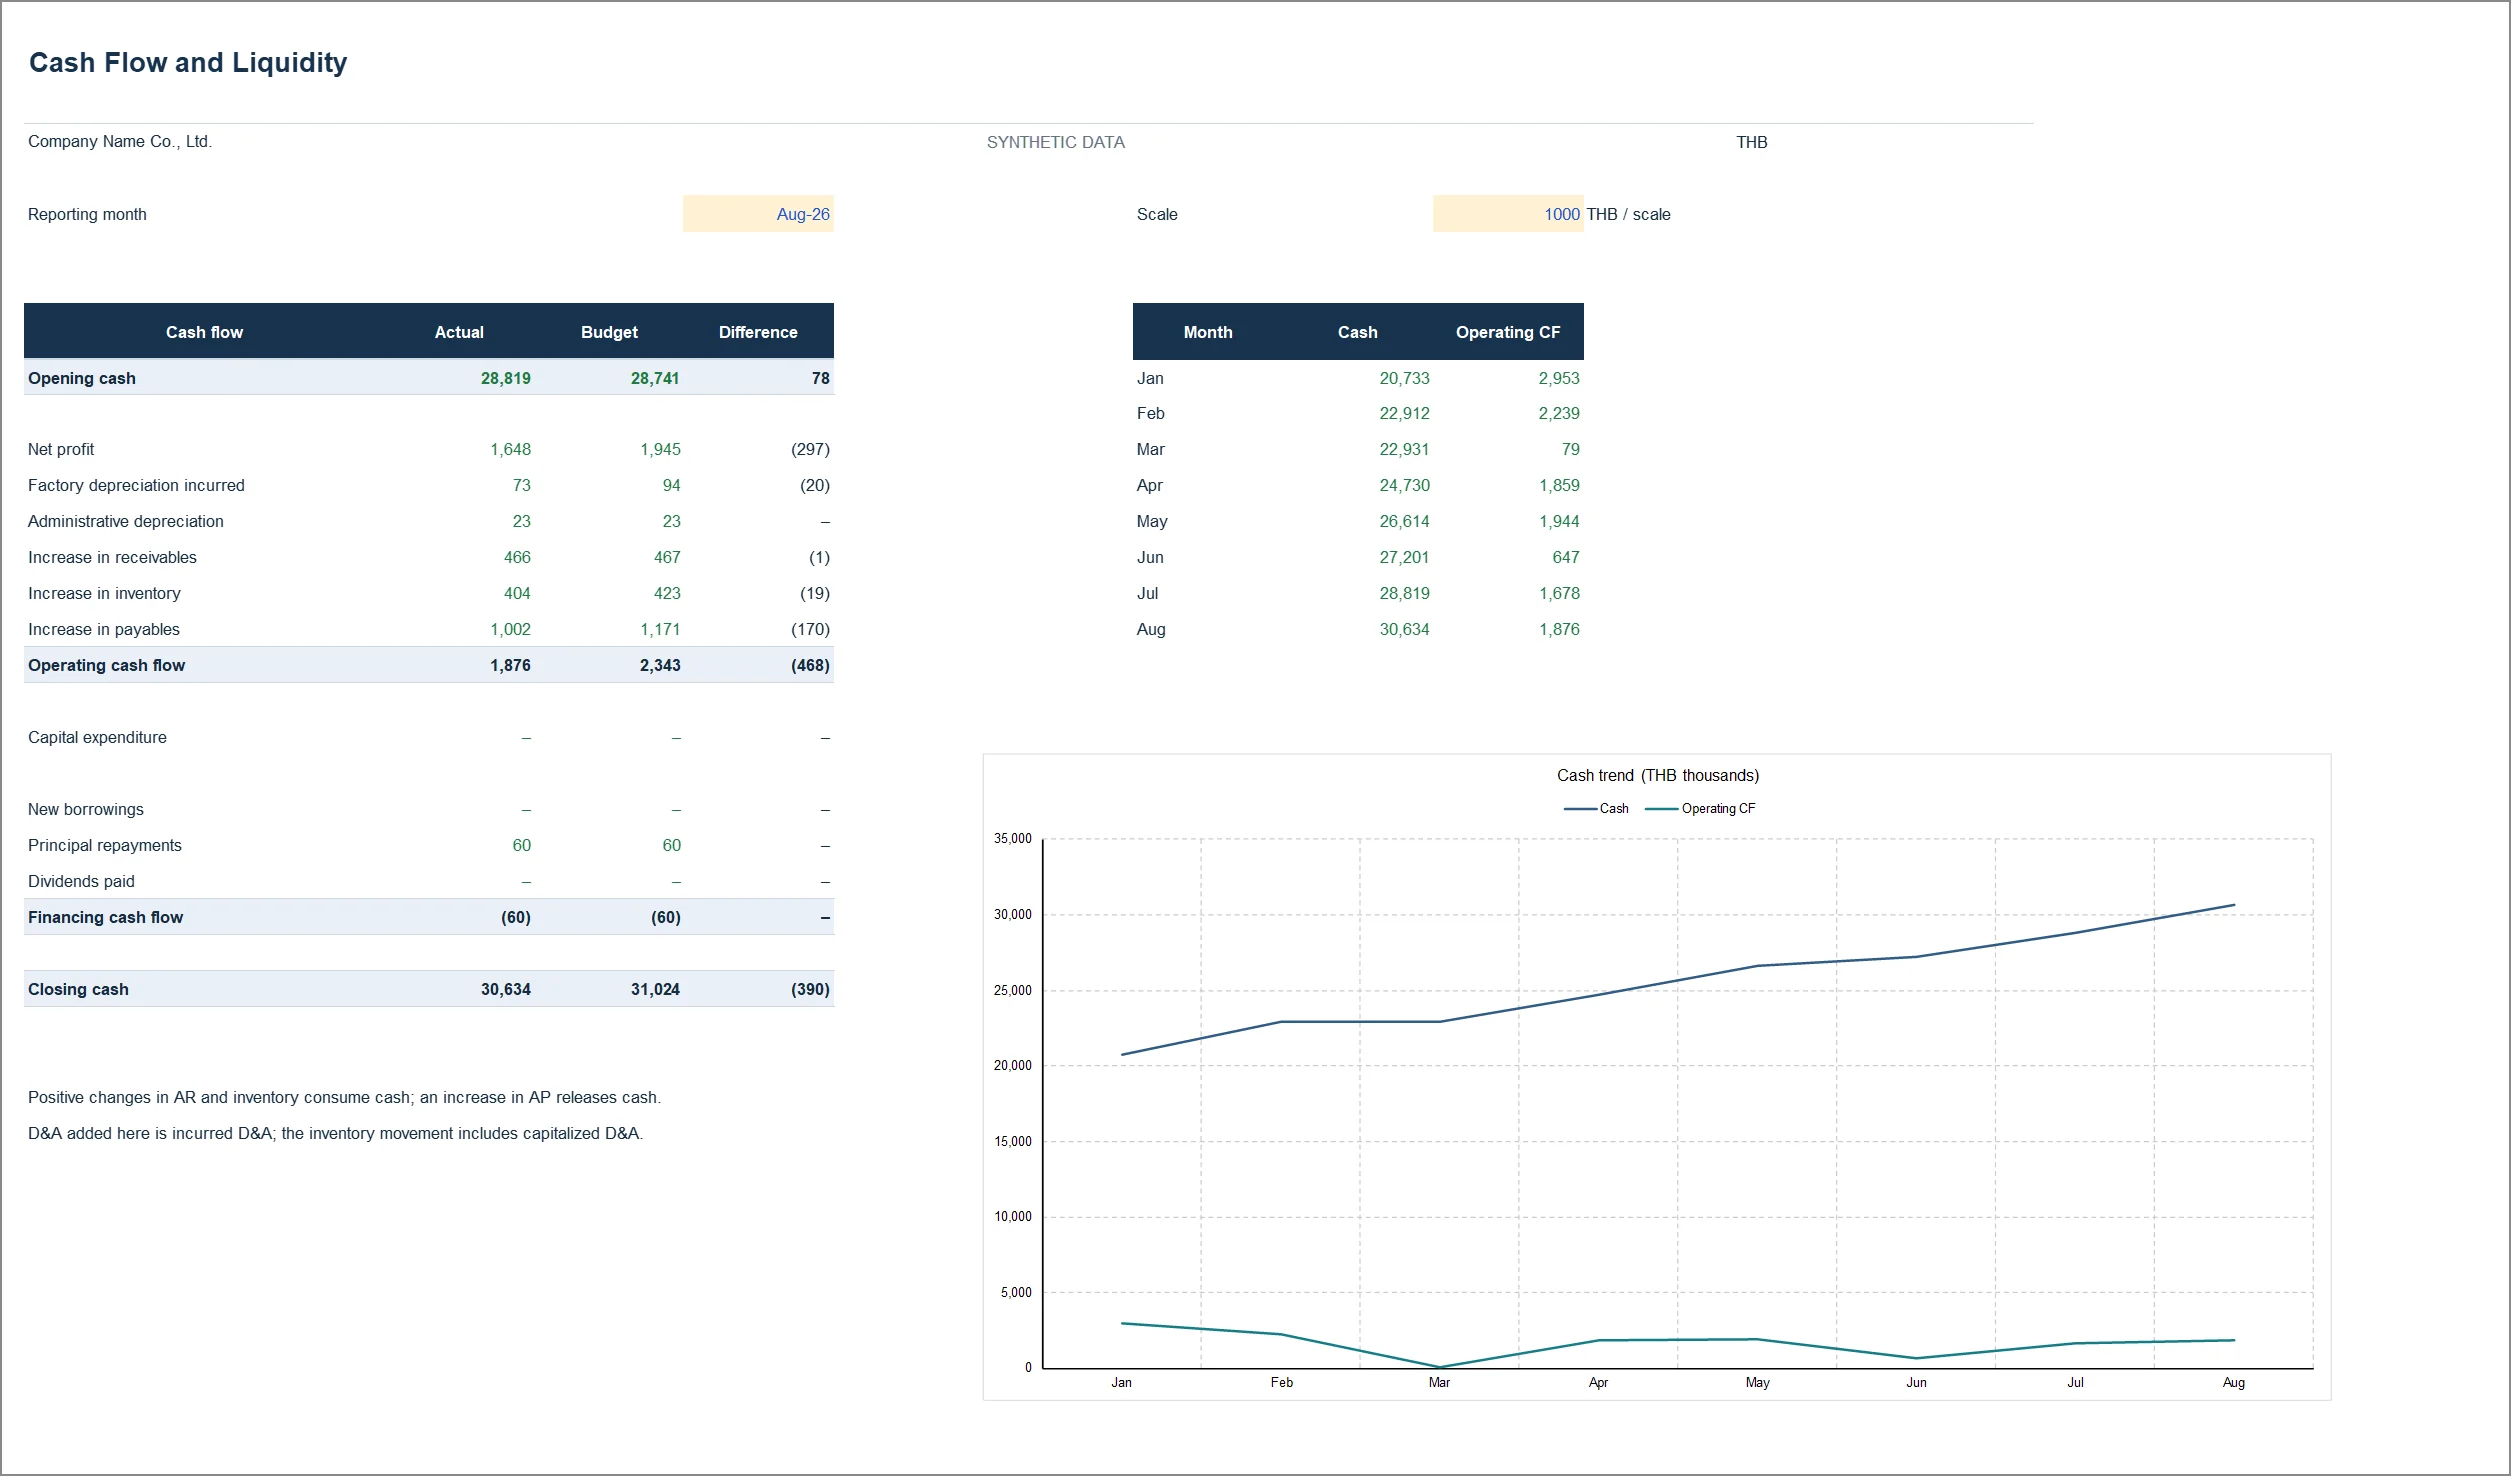
Captured from 06_Cash_Balance_and_Inventory_EN.xlsx, sheet Cash Review, after recalculation in Microsoft Excel. Click the image to zoom. Open full-size image
Figures from the sample workbook
| Measure | Amount | Type |
|---|---|---|
| Net profit | 1.648 | Monthly flow |
| Operating cash flow | 1.876 | Monthly flow |
| Closing cash | 30.634 | Balance |
| Trade receivables | 11.274 | Balance |
| Inventory | 7.646 | Balance |
THB millions · First two rows are flows; the rest are closing balances
Reading order
- Start with net profit, add back non-cash items, then read changes in receivables, inventory and payables.
- Review capital spending, borrowing, debt repayments and dividends to explain closing cash.
- Reconcile assets to liabilities plus equity, then investigate inventory movements and ageing.
Reading the figures in a worked case
Net profit is about THB 1.648m, while operating cash flow is about THB 1.876m because depreciation and working-capital movements also matter. Closing cash of THB 30.634m additionally includes opening cash, investment and financing movements.
How it is calculated, in plain language
Cash is not profit. The example's DSO/DIO ratios use closing balances and are approximations. WIP is fixed at THB 200,000 and must be adapted to the actual production process.
See this number → check what → weigh which decision
Example cases from the synthetic August 2026 data. Every figure comes from the same Excel dataset; the interpretation is a starting point, not a business conclusion.
- You see
Operating cash flow of THB 1.876m is higher than net profit of THB 1.648m
- Check next
Walk the bridge: depreciation +THB 95.6k, receivables up −THB 0.466m, inventory up −THB 0.404m, payables up +THB 1.002m. Payment days are a constant 30 in this model, so payables rose with purchase volume, not because supplier terms changed.
- Decision to weigh
Whether the higher purchasing supports demand that is actually coming or is building excess stock, and whether the real supplier payment terms deserve a review.
- You see
Receivables of THB 11.274m equal 32 days of sales, and inventory of THB 7.646m equals 33 days of cost of sales
- Check next
Trade working capital (receivables + inventory − payables) is THB 12.550m. Try the lab on the home page: each extra day of collection ties up about THB 0.352m. Open the Inventory sheet to see which product holds the most days of stock.
- Decision to weigh
What DSO and stock-day targets to set for next year, and for which product a lower stock level is worth the stock-out risk.
- You see
Inventory of THB 7.646m splits into trading goods 2.529, finished goods 2.466, raw materials 2.451 and WIP 0.200 THB m
- Check next
The Production sheet shows finished goods carry allocated factory payroll and depreciation, which EBITDA does not add back until the goods are sold. WIP is a constant in the demo. Reconcile to the physical count and raw-material ageing.
- Decision to weigh
Whether to cut raw-material purchases or production next month now that sales are below plan, and who owns the stock-level decision.
Core calculations in the workbook
| Measure | Definition |
|---|---|
| Trade working capital | Trade AR + total inventory − trade AP |
| General working capital | Current assets − current liabilities; requires complete current-liability classification |
| DSO proxy | Closing AR / monthly net revenue × days in month |
| DIO proxy | Closing inventory / monthly COGS × days in month |
| Inventory roll | Opening inventory + receipts − COGS = closing inventory |
How to use this report in the workbook
Purpose
Explain why profit differs from cash, monitor balance-sheet movements and reconcile inventory and production cost.
Cash flow
The main page builds indirect operating cash flow and reconciles to ending cash. Checks also independently derives direct operating cash flow from receipts/payments.
The balance sheet
Balance Sheet compares current and prior actual month in THB thousands. Debt is combined, so the file deliberately does not publish current ratio before debt maturity classification.
Inventory
Inventory shows trading/finished-goods quantities and values, plus raw-material balances. All inventory details use full THB. WIP is fixed at 200,000 in this demonstration.
Factory cost treatment
Production cost includes materials, factory payroll, cash overhead and factory depreciation. Equal resource consumption per produced unit is only a simplifying allocation assumption.
DSO and DIO ratios
DSO and DIO use closing balances and actual days in the selected month. These are labelled approximations; use average balances and credit sales for a refined analysis.
Reading and editing essentials
- Always check the company, reporting period and currency scale. A displayed value of 1,000 in a THB-thousands table means THB 1,000,000.
- Actual means recorded results, Budget means plan, and Forecast means estimate. Do not describe a forecast as an achieved result.
- The usual arithmetic variance is Actual minus Budget. Higher revenue or profit is generally favourable; higher costs require investigation of overspending and activity levels.
- Revenue and profit are flows that can be summed across months. Cash, receivables and inventory are balances measured at a particular date.
- Calculate aggregate margin as total profit divided by total revenue. A value of n.a. means a ratio cannot be calculated under the applicable conditions; it should not be replaced with zero without justification.
- Thai and English workbooks are independent files. Editing one does not update the other. Choose a working master, retain backups and refresh related files consistently.
- Before using company data, reconcile the accounts and check dates, version names and formula ranges. Adding rows or months may require extending formulas, charts and controls.
- Read the Checks sheet, but do not treat OK as assurance over everything. Source coverage controls focus on the selected actual month; budget and forecast coverage also need review.
- All data is illustrative. Adapt costing, tax, calendar and funding policies to the business. The pack is a starting point for management reporting.
Related workbook
06_Cash_Balance_and_Inventory_EN.xlsx
Main sheet Cash Review / กระแสเงินสด · Sources PL_Data + BS_Data + CF_Data + Sales_Data · The workbook and Markdown guide are in the Excel pack
Use your browser’s print command to save this page as a PDF.
Common questions
Why is operating cash flow different from net profit?
Depreciation is added back because no cash left the business, then the movements in receivables, inventory and payables are applied. In the example net profit is THB 1.648m but operating cash flow is 1.876m, because payables rose 1.002m, more than the 0.466m rise in receivables and the 0.404m rise in inventory combined.
How are DSO and DIO calculated?
DSO = closing receivables ÷ revenue for the month × days in the month. DIO = closing inventory ÷ cost of sales for the month × days in the month. Both are approximations from month-end balances; the example gives 32 and 33 days. More in the cash conversion cycle article.
What is trade working capital?
Receivables + inventory − payables: the cash held in day-to-day trading. In the example it is THB 12.550m, and each extra day customers take to pay ties up roughly another 0.352m.

