
Executive Review
Bring revenue, profitability and liquidity into one conversation before moving into the detailed reports.
The report as it appears in Excel
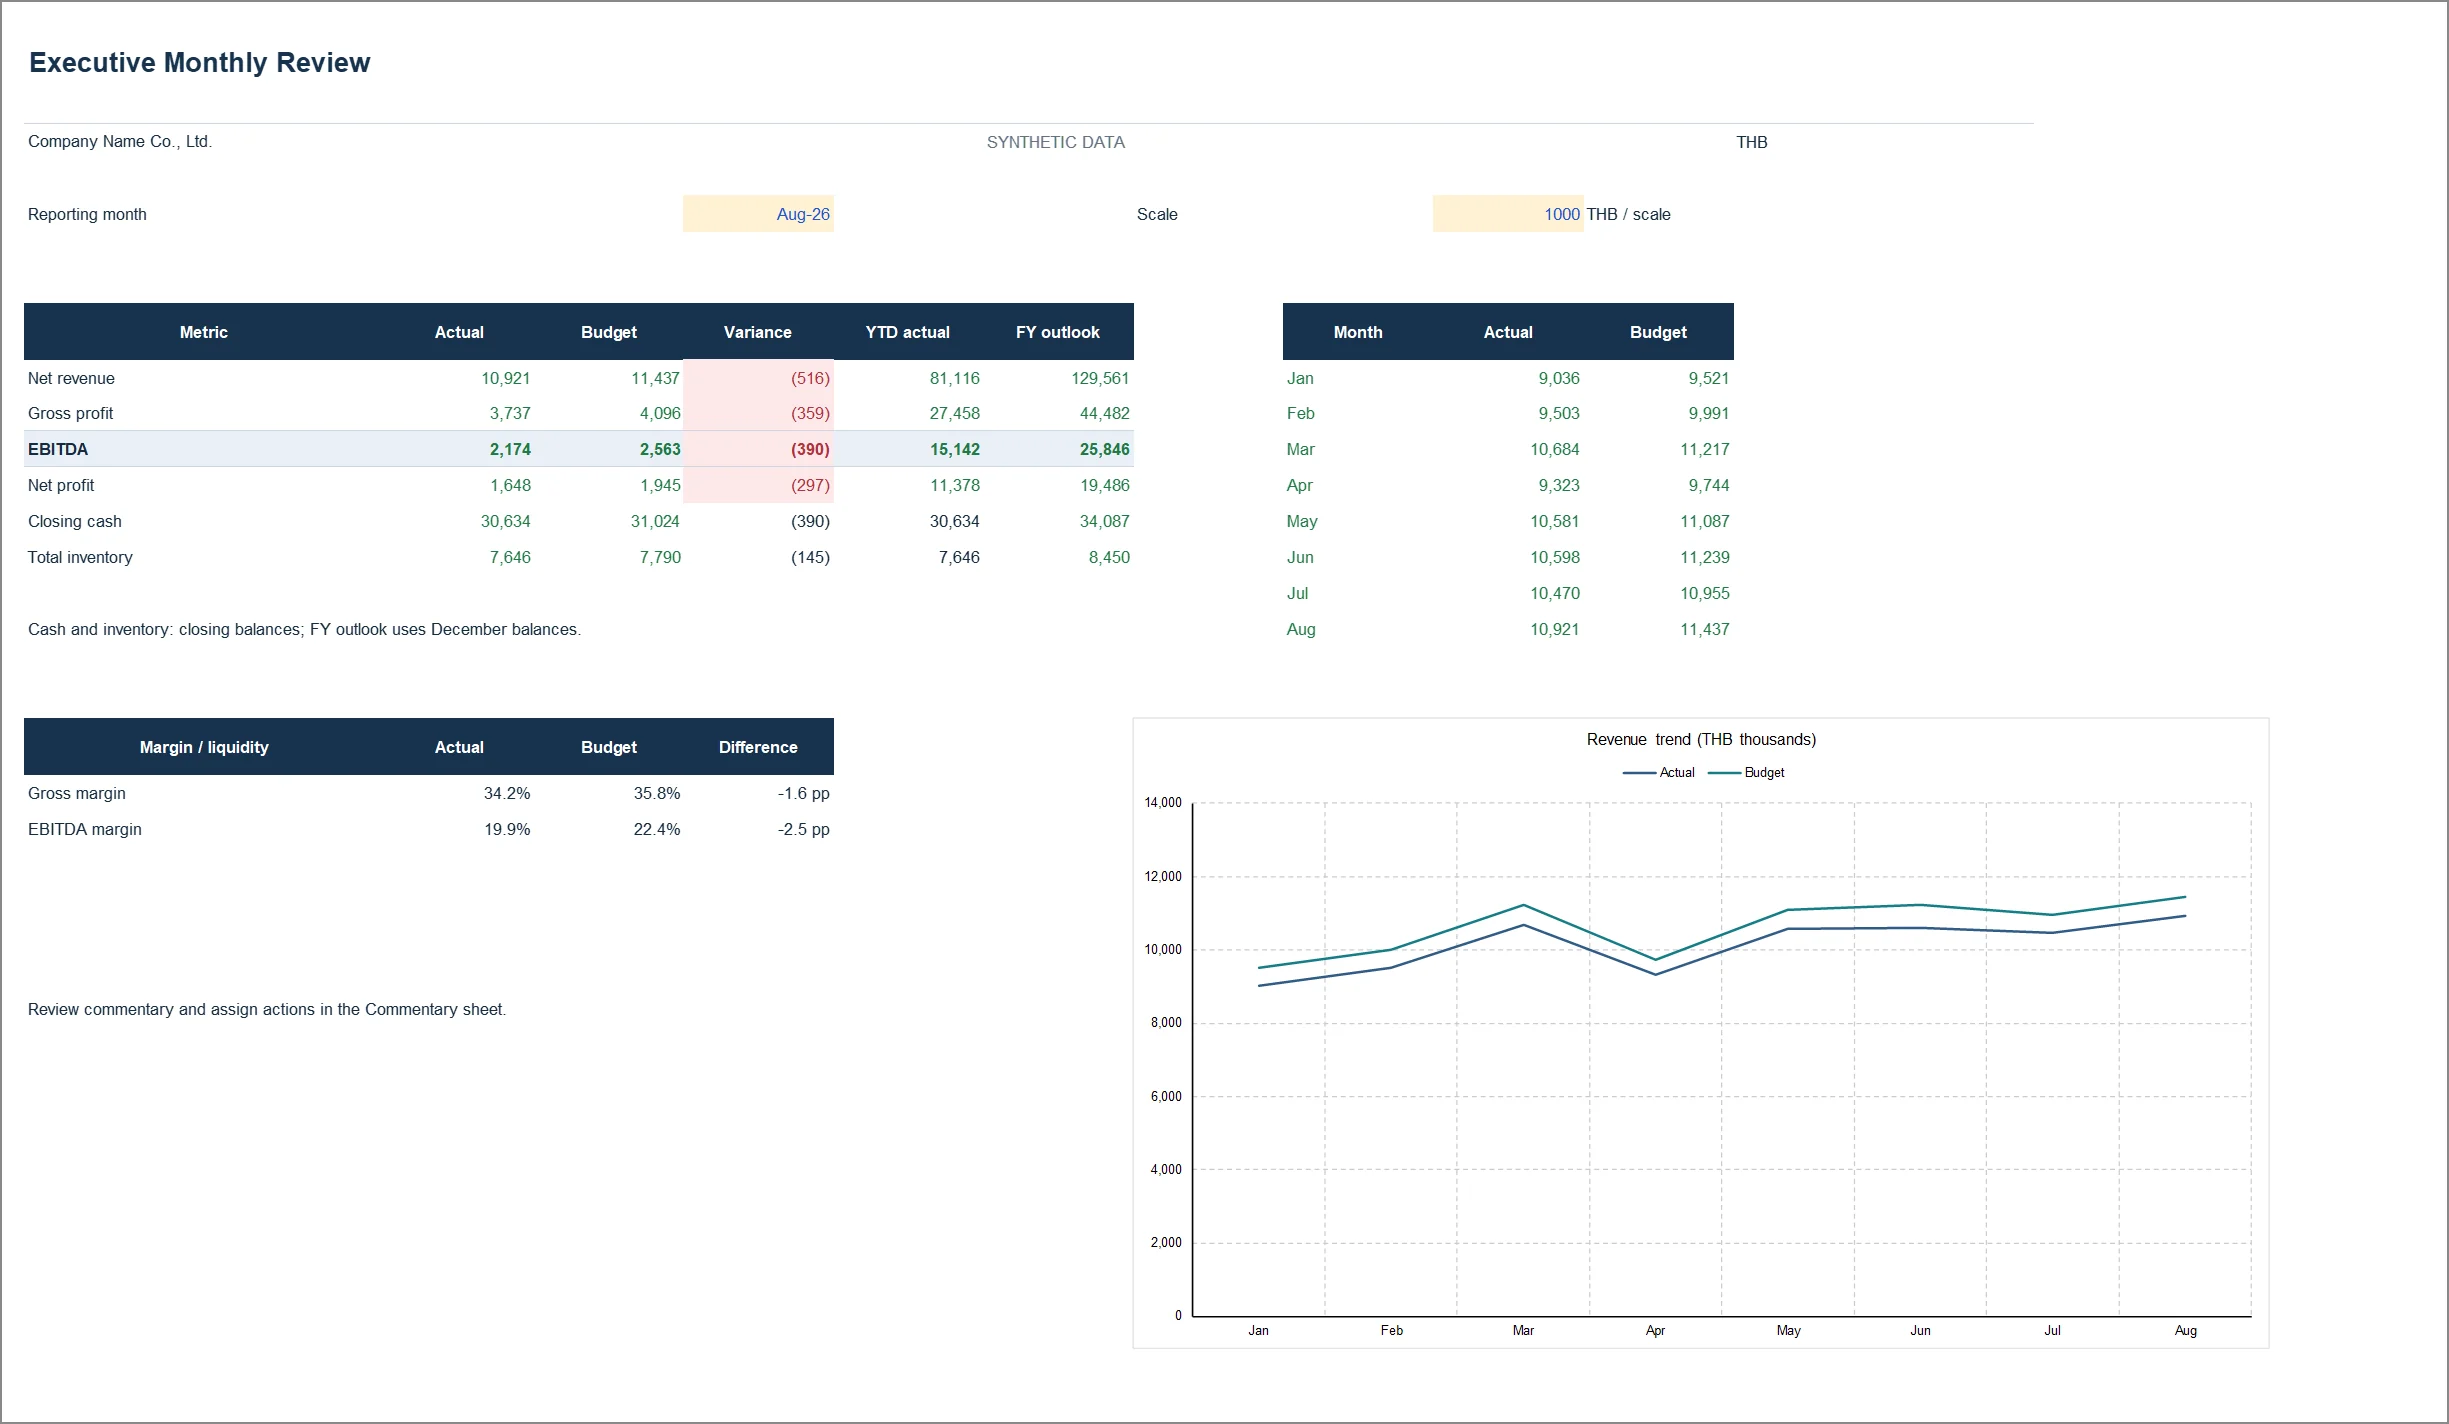
Captured from 01_Executive_Review_EN.xlsx, sheet Executive, after recalculation in Microsoft Excel. Click the image to zoom. Open full-size image
Figures from the sample workbook
| Measure | Actual | Budget |
|---|---|---|
| Net revenue | 10.921 | 11.437 |
| Gross profit | 3.737 | 4.096 |
| EBITDA | 2.174 | 2.563 |
| Net profit | 1.648 | 1.945 |
| Closing cash | 30.634 | 31.024 |
THB millions · Cash is the month-end balance
Reading order
- Check the reporting month and currency scale, then compare actual revenue, profit and cash with budget.
- Read the current month, year-to-date flows and full-year outlook to separate an isolated month from an ongoing trend.
- Select one to three material issues. Record an evidenced cause, an action, an owner and a due date.
Reading the figures in a worked case
Actual revenue of THB 10.921m is about THB 0.516m, or 4.51%, below the THB 11.437m budget. Open Sales and Margin to investigate price and volume. The variance alone does not establish its cause.
How it is calculated, in plain language
Do not add monthly cash or inventory balances into a YTD total. Example commentary is not a verified business explanation.
See this number → check what → weigh which decision
Example cases from the synthetic August 2026 data. Every figure comes from the same Excel dataset; the interpretation is a starting point, not a business conclusion.
- You see
Revenue is THB 10.921m, 4.51% below budget, and the 8-month total of THB 81.1m is also below the THB 85.2m budget
- Check next
Open the Trend sheet: actual is below budget every month since January, so this is a run rate, not a one-off. Continue to report 03 to see whether volume or price explains it.
- Decision to weigh
Whether the THB 129.6m full-year estimate against the THB 136.1m budget still holds, and what plan the sales owner should bring to the next meeting.
- You see
EBITDA margin is 19.9% against a 22.4% budget, a gap of -2.5 percentage points
- Check next
Separate the margin drop into gross margin (reports 02 and 03) and SG&A (report 04). In this example gross margin fell -1.59 points and OPEX ran 0.80% over budget.
- Decision to weigh
Which issue leads the agenda, and whether gross margin and operating spend need separate owners.
- You see
Closing cash is THB 30.634m against a THB 31.024m budget, while the year-end outlook is THB 34.087m
- Check next
Cash is a balance, never summed across months. Open report 06 to see whether receivables or inventory slowed the cash conversion, and report 05 to confirm the year-end figure already includes THB 3.3m of planned CAPEX.
- Decision to weigh
Whether the cash position still covers the investment plan and scheduled repayments, and what minimum cash buffer to set.
Core calculations in the workbook
| Measure | Definition |
|---|---|
| Gross margin | Gross profit / net revenue |
| EBITDA margin | EBITDA / net revenue |
| Margin gap | (Actual margin − budget margin) × 100 percentage points |
How to use this report in the workbook
Purpose
Use at the monthly management meeting to connect revenue, profitability, liquidity and accountable actions.
How to read
Review actual versus budget, then YTD flows and full-year outlook. Cash and inventory are ending balances; never add monthly balances together.
Follow-up actions
Commentary contains editable examples, not verified business explanations. Replace each example with an evidenced cause, action, owner and due date.
The chart
The revenue chart uses Jan–Aug 2026 in THB thousands, independently of the main display divisor. Extend Trend and chart series for later months.
Reading and editing essentials
- Always check the company, reporting period and currency scale. A displayed value of 1,000 in a THB-thousands table means THB 1,000,000.
- Actual means recorded results, Budget means plan, and Forecast means estimate. Do not describe a forecast as an achieved result.
- The usual arithmetic variance is Actual minus Budget. Higher revenue or profit is generally favourable; higher costs require investigation of overspending and activity levels.
- Revenue and profit are flows that can be summed across months. Cash, receivables and inventory are balances measured at a particular date.
- Calculate aggregate margin as total profit divided by total revenue. A value of n.a. means a ratio cannot be calculated under the applicable conditions; it should not be replaced with zero without justification.
- Thai and English workbooks are independent files. Editing one does not update the other. Choose a working master, retain backups and refresh related files consistently.
- Before using company data, reconcile the accounts and check dates, version names and formula ranges. Adding rows or months may require extending formulas, charts and controls.
- Read the Checks sheet, but do not treat OK as assurance over everything. Source coverage controls focus on the selected actual month; budget and forecast coverage also need review.
- All data is illustrative. Adapt costing, tax, calendar and funding policies to the business. The pack is a starting point for management reporting.
Related workbook
01_Executive_Review_EN.xlsx
Main sheet Executive / สรุปผู้บริหาร · Sources PL_Data + BS_Data · The workbook and Markdown guide are in the Excel pack
Use your browser’s print command to save this page as a PDF.

