
P&L · Budget vs Actual
Follow revenue down to net profit, with monthly variance, year-to-date performance and a full-year estimate.
The report as it appears in Excel
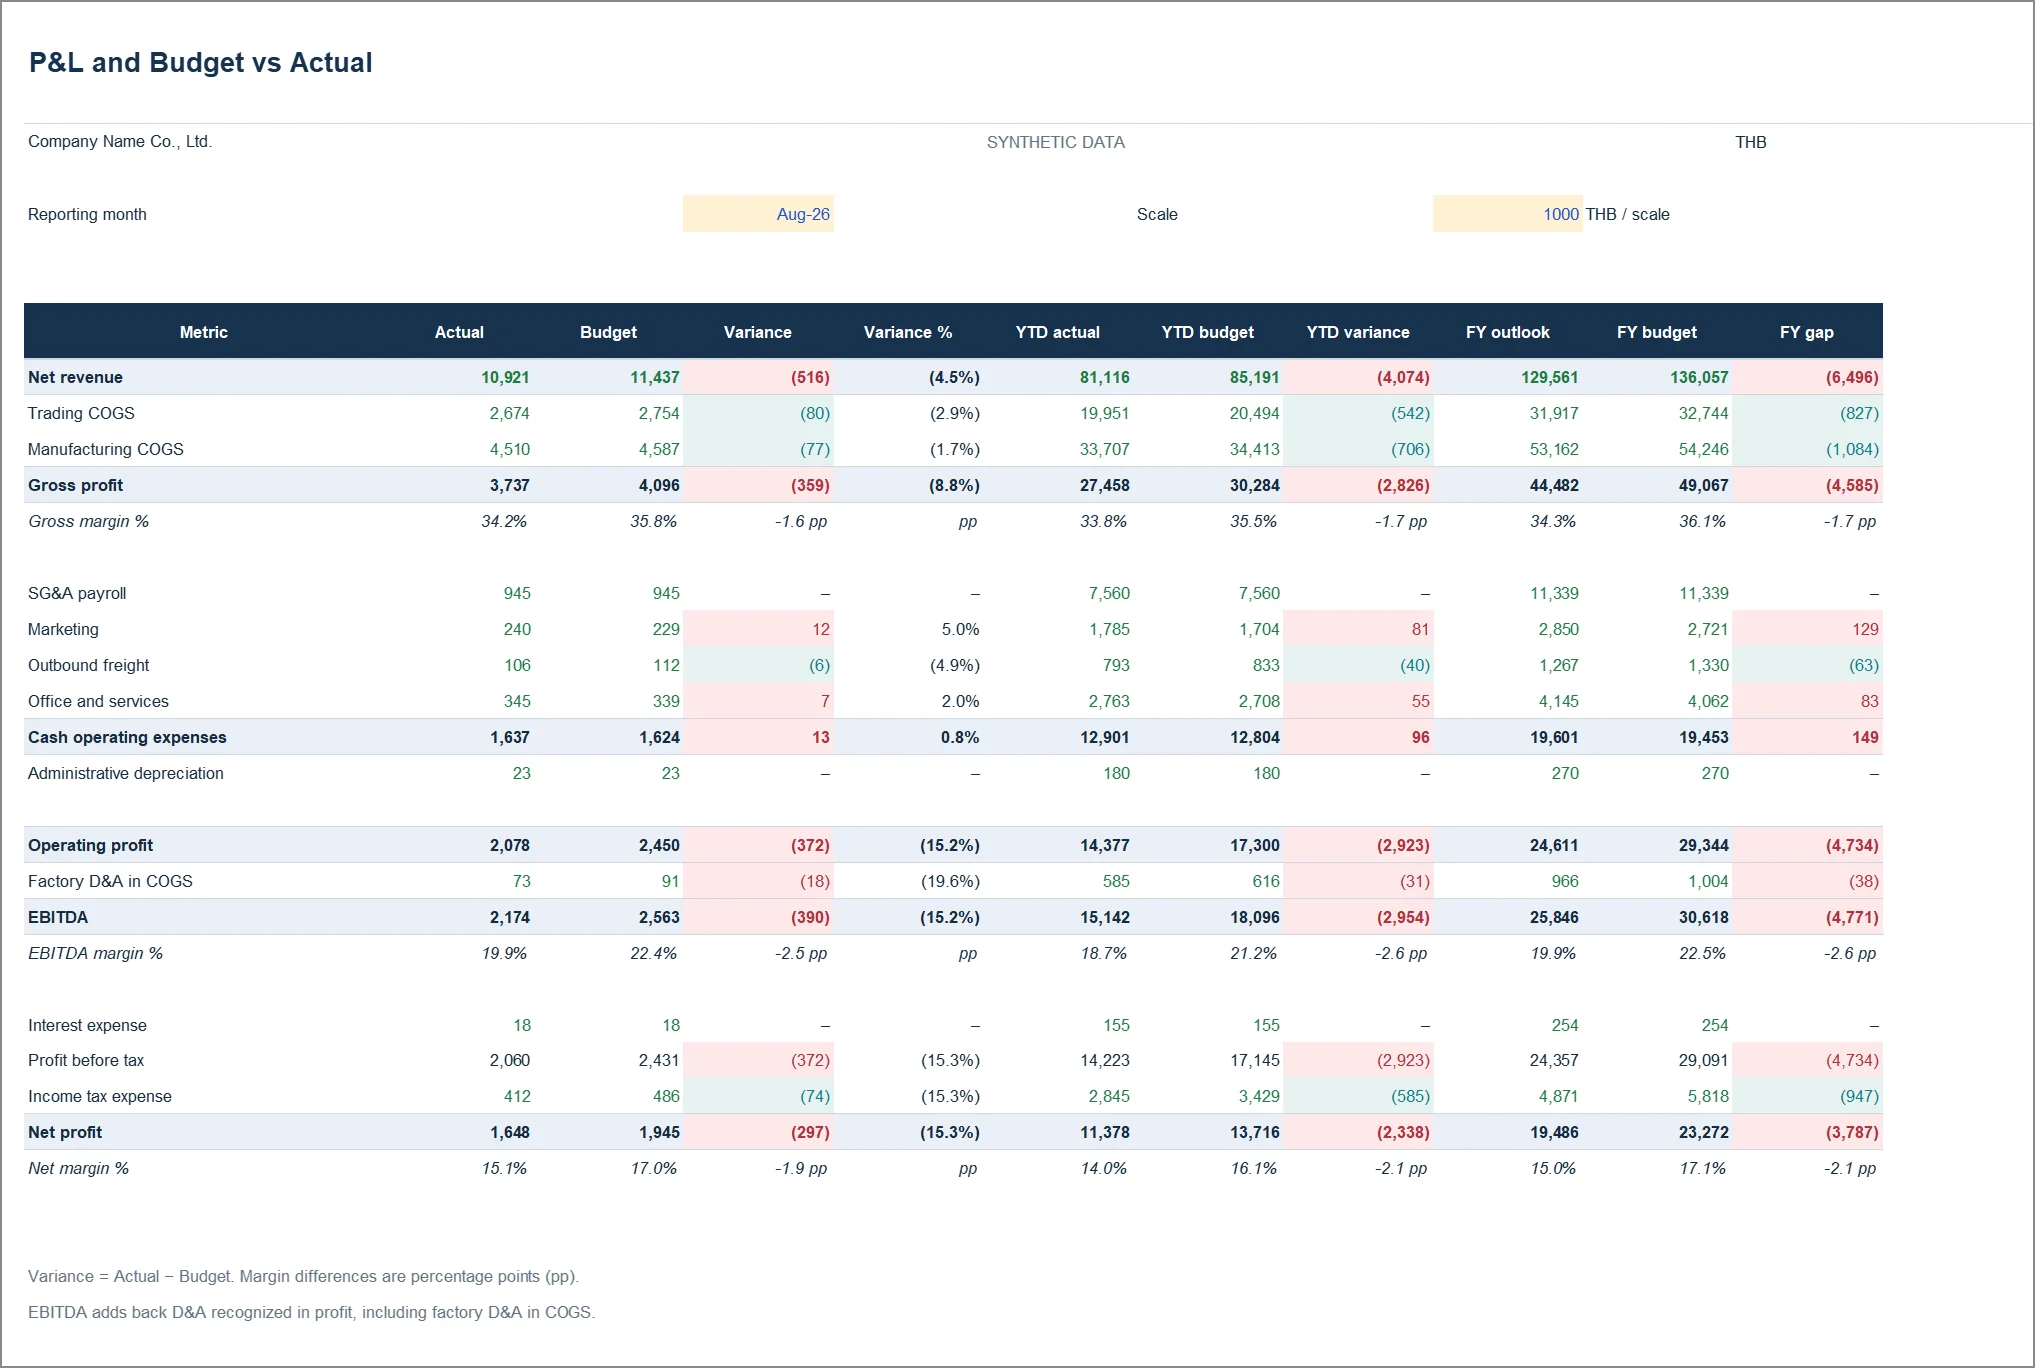
Captured from 02_PnL_Budget_vs_Actual_EN.xlsx, sheet PnL, after recalculation in Microsoft Excel. Click the image to zoom. Open full-size image
Figures from the sample workbook
| Measure | Actual | Budget |
|---|---|---|
| Net revenue | 10.921 | 11.437 |
| Gross profit | 3.737 | 4.096 |
| Gross margin | 34.22% | 35.81% |
| EBITDA | 2.174 | 2.563 |
| Net profit | 1.648 | 1.945 |
THB millions, except gross margin shown as %
Reading order
- Read in sequence: revenue → cost of goods sold → gross profit → operating expenses → net profit.
- Read amount and percentage variances together. An expense above budget is unfavourable even though Actual minus Budget is positive.
- Separate one-off effects from recurring changes, then decide whether the full-year estimate needs updating.
Reading the figures in a worked case
Gross margin is 34.22% against a 35.81% budget: about -1.59 percentage points, not -1.59%. Investigate selling prices, unit costs and the revenue contribution of different products.
How it is calculated, in plain language
Calculate aggregate margin as total profit divided by total revenue. For EBITDA, add back depreciation already recognised in profit, excluding amounts still held in inventory.
See this number → check what → weigh which decision
Example cases from the synthetic August 2026 data. Every figure comes from the same Excel dataset; the interpretation is a starting point, not a business conclusion.
- You see
Net profit of THB 1.648m is THB 0.297m below the THB 1.945m budget
- Check next
Walk the lines: revenue is short by THB 0.516m and gross profit by THB 0.359m, so cost of sales did not fall in step with revenue. OPEX is only THB 12.92k over budget. The story sits above the gross-profit line.
- Decision to weigh
Whether to start with selling prices and unit costs with sales and production, rather than with operating spend, which moves profit far less here.
- You see
The full-year net profit estimate is THB 19.5m against a THB 23.3m budget
- Check next
The Monthly sheet combines Jan–Aug actuals with Sep–Dec latest estimate. Confirm the remaining four months use the same volume and price drivers as the report 05 base case, and that the THB 2.338m year-to-date shortfall is already reflected.
- Decision to weigh
Whether to formally re-forecast to management now, and which figure remains the target the team is held to.
- You see
The marketing variance shows +THB 11.53k
- Check next
For expenses a positive variance means overspend. Check whether it is a campaign shifted from another month or a new run rate, and read it beside the revenue shortfall in the same month.
- Decision to weigh
Whether marketing spend should be held to support sales or scaled to the lower revenue, who owns that budget and by when they decide.
Core calculations in the workbook
| Measure | Definition |
|---|---|
| Gross profit | Revenue − trading COGS − manufacturing COGS |
| Operating profit | Gross profit − cash SG&A − administrative D&A |
| EBITDA | Operating profit + administrative D&A + factory D&A recognized in COGS |
| Net profit | Operating profit − interest − income tax |
How to use this report in the workbook
Purpose
Explain monthly and year-to-date profit variance and the latest full-year estimate versus the approved annual budget.
How to read
Start with revenue, gross profit, operating profit and net profit. Inspect each cost line behind a material gap; percentages alone can exaggerate small budgets.
Reading the variance sign
Raw variance is Actual − Budget. Higher revenue/profit is favourable; higher expense is unfavourable. A percentage is n.a. when the budget denominator is zero.
Account mapping
Mapping is an example chart-of-accounts guide, not an automated importer. Map factory labour and factory D&A to production/inventory, avoiding duplicate SG&A recognition.
The Monthly sheet
Monthly fixes Jan–Aug as actual and Sep–Dec as latest estimate for the 2026 demonstration. A real monthly roll requires explicitly updating the cutoff and versions.
Reading and editing essentials
- Always check the company, reporting period and currency scale. A displayed value of 1,000 in a THB-thousands table means THB 1,000,000.
- Actual means recorded results, Budget means plan, and Forecast means estimate. Do not describe a forecast as an achieved result.
- The usual arithmetic variance is Actual minus Budget. Higher revenue or profit is generally favourable; higher costs require investigation of overspending and activity levels.
- Revenue and profit are flows that can be summed across months. Cash, receivables and inventory are balances measured at a particular date.
- Calculate aggregate margin as total profit divided by total revenue. A value of n.a. means a ratio cannot be calculated under the applicable conditions; it should not be replaced with zero without justification.
- Thai and English workbooks are independent files. Editing one does not update the other. Choose a working master, retain backups and refresh related files consistently.
- Before using company data, reconcile the accounts and check dates, version names and formula ranges. Adding rows or months may require extending formulas, charts and controls.
- Read the Checks sheet, but do not treat OK as assurance over everything. Source coverage controls focus on the selected actual month; budget and forecast coverage also need review.
- All data is illustrative. Adapt costing, tax, calendar and funding policies to the business. The pack is a starting point for management reporting.
Related workbook
02_PnL_Budget_vs_Actual_EN.xlsx
Main sheet PnL / กำไรขาดทุน · Sources PL_Data · The workbook and Markdown guide are in the Excel pack
Use your browser’s print command to save this page as a PDF.

