
Sales & Gross Margin
Explore revenue and gross profit by product and business line, then investigate price and volume effects.
The report as it appears in Excel
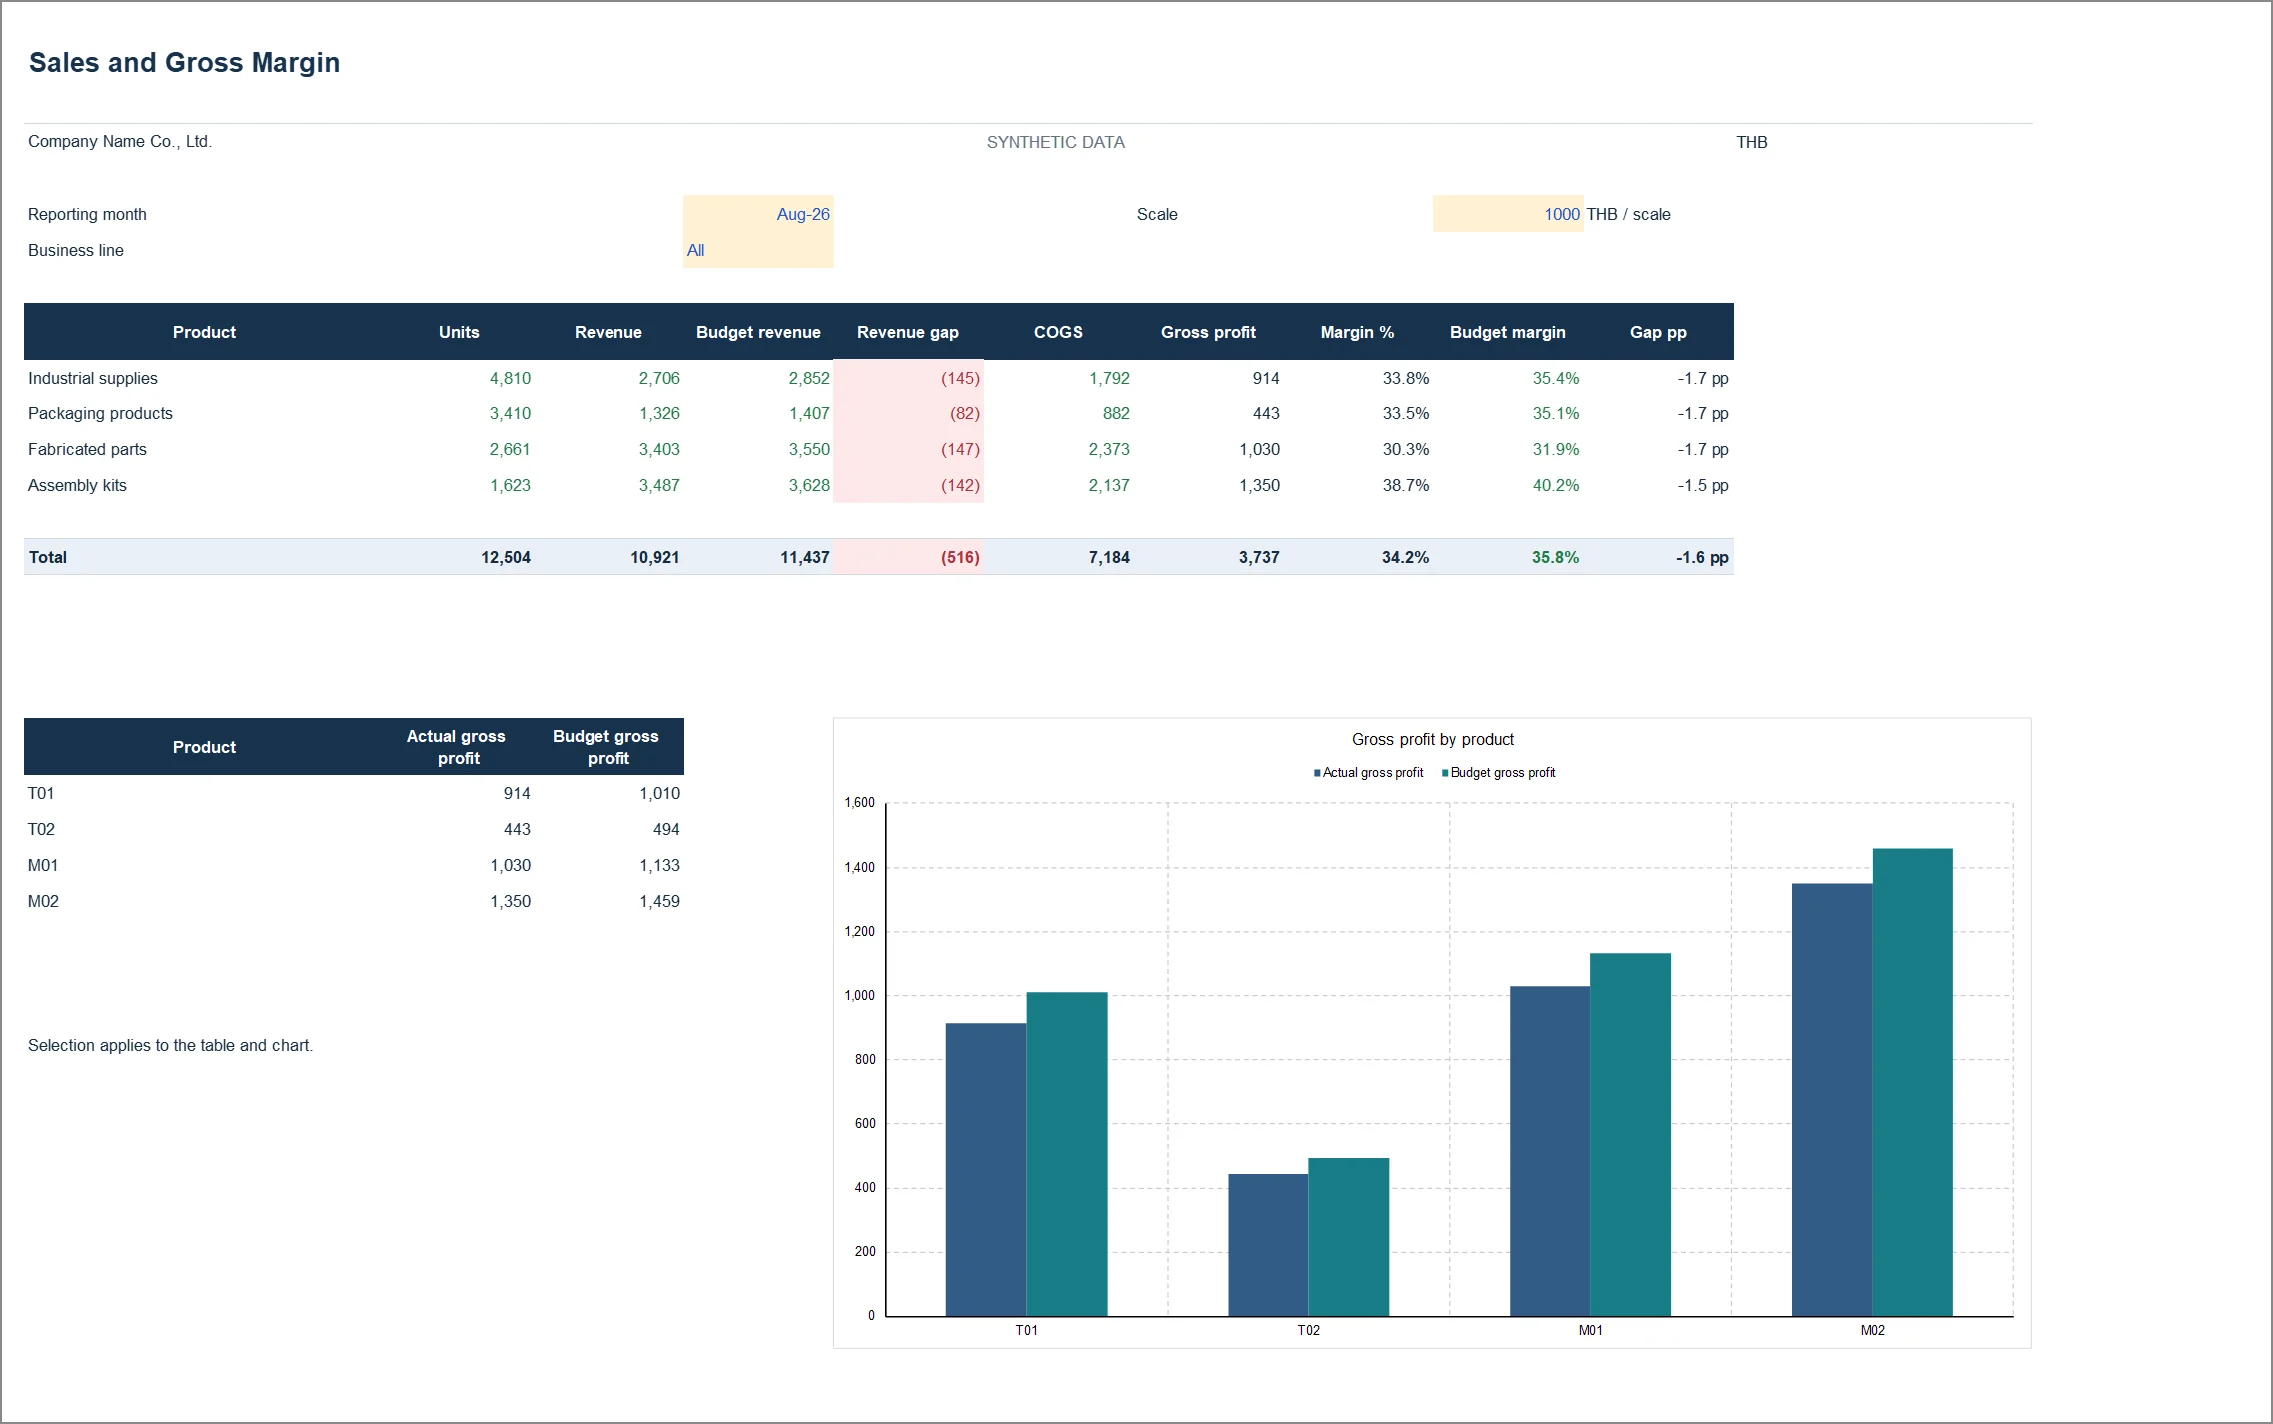
Captured from 03_Sales_and_Margin_EN.xlsx, sheet Sales Review, after recalculation in Microsoft Excel. Click the image to zoom. Open full-size image
Figures from the sample workbook
| Product | Revenue | Gross profit | Margin |
|---|---|---|---|
| Industrial supplies | 2.706 | 0.914 | 33.78% |
| Packaging products | 1.326 | 0.443 | 33.45% |
| Fabricated parts | 3.403 | 1.030 | 30.26% |
| Assembly kits | 3.487 | 1.350 | 38.72% |
THB millions · Actual results for four products
Reading order
- Compare revenue, gross profit in currency and gross margin. Do not rank products by revenue alone.
- Select Trading or Manufacturing in Excel when reviewing a business line, and check each product's quantity unit.
- Use Price Volume to split revenue variance into volume and price effects, then investigate discounts, costs and sales evidence.
Reading the figures in a worked case
Assembly kits contribute about THB 1.350m of gross profit at a 38.72% margin. Fabricated parts have a margin of about 30.26%. This is a starting point for investigation, not an automatic reason to discontinue the lower-margin product.
How it is calculated, in plain language
Quantities with different units should not be combined into a meaningful productivity measure. The pack's Price Volume detail shows all products even when the main sheet has a business-line filter.
See this number → check what → weigh which decision
Example cases from the synthetic August 2026 data. Every figure comes from the same Excel dataset; the interpretation is a starting point, not a business conclusion.
- You see
The Price Volume sheet attributes the whole THB 0.516m revenue shortfall to volume; the price effect is zero for every product
- Check next
Every product sold below budget, for example Industrial supplies at 4,810 units against 5,068. Ask sales whether demand softened, stock ran short or orders slipped into next month.
- Decision to weigh
Whether to hold price and fix volume, or to use discounts to lift volume, which moves the problem from quantity into margin.
- You see
Assembly kits earn the most gross profit, THB 1.350m at 38.72%, while Fabricated parts bring similar revenue of THB 3.403m at only 30.26%
- Check next
Both are manufactured; their cost includes factory payroll and depreciation allocated per unit produced. Check the Production sheet in report 06 to see whether material cost per unit or the overhead allocation is compressing the margin.
- Decision to weigh
Whether to revisit the price of Fabricated parts or to shift the sales mix toward the higher-margin product, without dropping a product on one month's numbers.
- You see
The trading business line's combined gross margin is 33.67% against a 35.33% budget
- Check next
Set F7 to Trading to isolate the line. Selling prices equal budget, so the lower margin comes from the cost of goods received and the weighted-average stock method. Check recent purchase prices with procurement.
- Decision to weigh
Whether to renegotiate purchase prices or reprice the trading products, and what that does to competitiveness.
Core calculations in the workbook
| Measure | Definition |
|---|---|
| Gross margin | (Revenue − COGS) / revenue; total margin is weighted by revenue |
| Volume effect | (Actual units − budget units) × budget unit price |
| Price effect | (Actual unit price − budget unit price) × actual units |
How to use this report in the workbook
Purpose
Identify which products and business lines generate revenue and gross profit, and separate price from volume effects.
The filter
F7 accepts All, Trading or Manufacturing. The product table and gross-profit chart follow this filter. The price/volume detail always shows all four products.
Units and scaling
Revenue and profit on the main sheet use K6 as divisor. Product quantities are unscaled. Price Volume is in THB and each product uses its own unit.
The price and volume bridge
Use budget-price volume effect and actual-volume price effect so their sum exactly equals revenue change. No separate mix effect is claimed for incomparable units.
When quantity is zero
When budget quantity is zero, all revenue change is classified as volume/new business. When actual quantity is zero, price effect is zero.
Reading and editing essentials
- Always check the company, reporting period and currency scale. A displayed value of 1,000 in a THB-thousands table means THB 1,000,000.
- Actual means recorded results, Budget means plan, and Forecast means estimate. Do not describe a forecast as an achieved result.
- The usual arithmetic variance is Actual minus Budget. Higher revenue or profit is generally favourable; higher costs require investigation of overspending and activity levels.
- Revenue and profit are flows that can be summed across months. Cash, receivables and inventory are balances measured at a particular date.
- Calculate aggregate margin as total profit divided by total revenue. A value of n.a. means a ratio cannot be calculated under the applicable conditions; it should not be replaced with zero without justification.
- Thai and English workbooks are independent files. Editing one does not update the other. Choose a working master, retain backups and refresh related files consistently.
- Before using company data, reconcile the accounts and check dates, version names and formula ranges. Adding rows or months may require extending formulas, charts and controls.
- Read the Checks sheet, but do not treat OK as assurance over everything. Source coverage controls focus on the selected actual month; budget and forecast coverage also need review.
- All data is illustrative. Adapt costing, tax, calendar and funding policies to the business. The pack is a starting point for management reporting.
Related workbook
03_Sales_and_Margin_EN.xlsx
Main sheet Sales Review / วิเคราะห์ยอดขาย · Sources Sales_Data + PL_Data · The workbook and Markdown guide are in the Excel pack
Use your browser’s print command to save this page as a PDF.

