
OPEX & Workforce
Review department spending, payroll and FTE to distinguish recurring costs from activity-driven changes.
The report as it appears in Excel
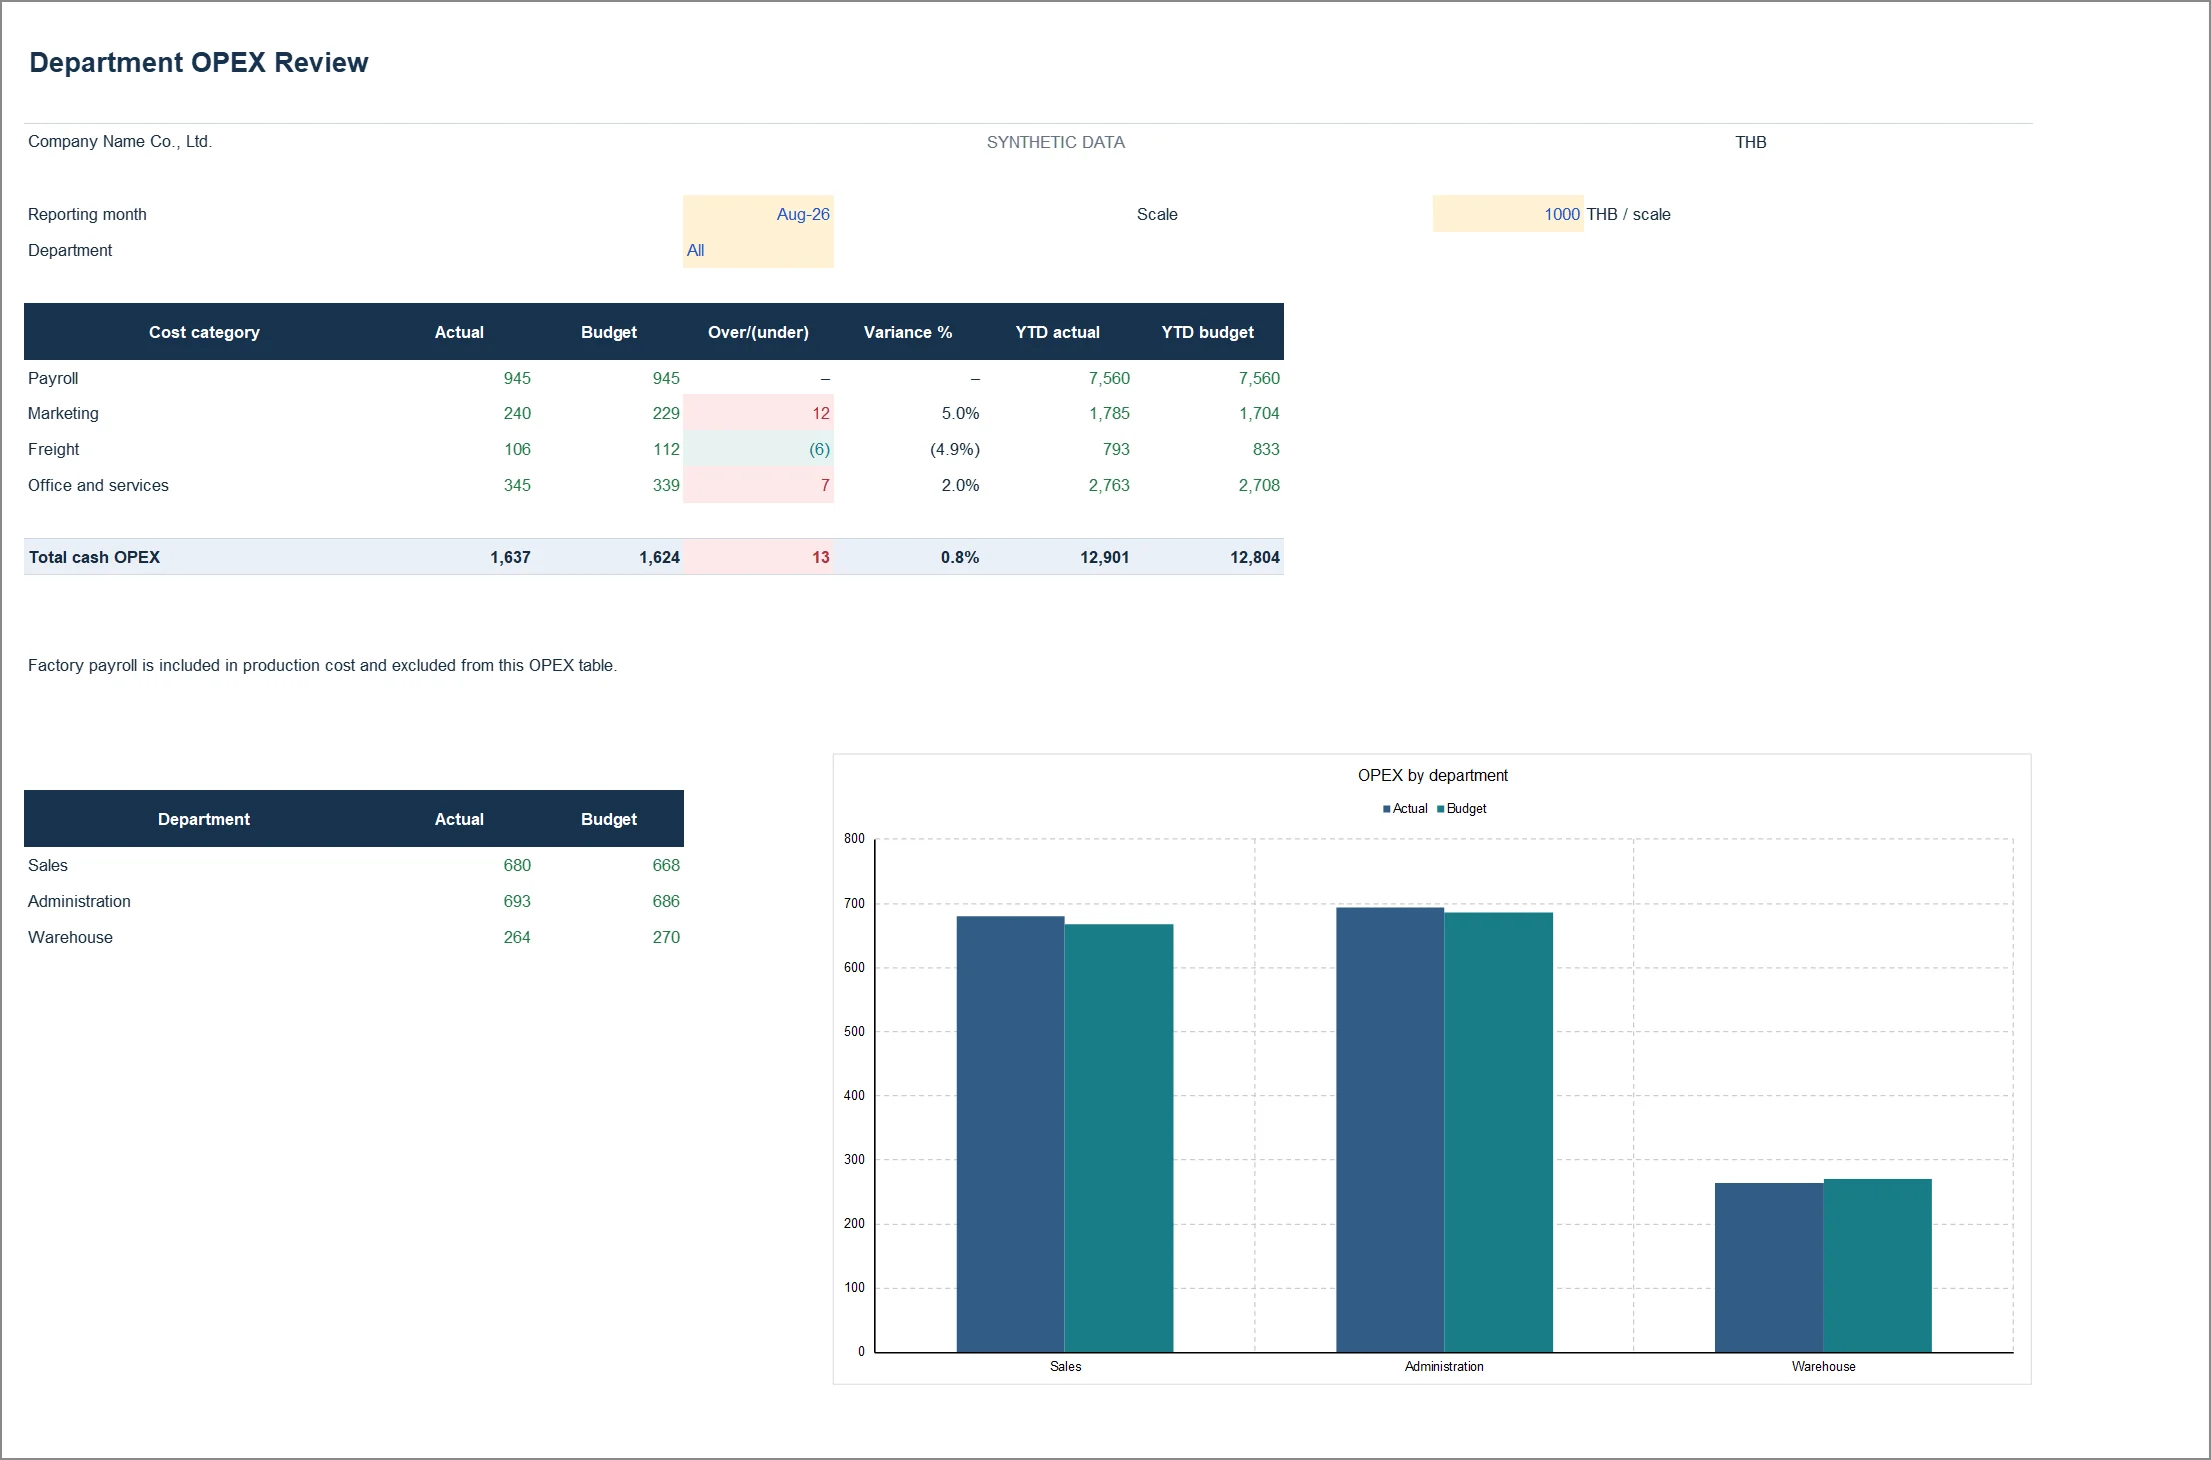
Captured from 04_OPEX_and_Workforce_EN.xlsx, sheet OPEX Review, after recalculation in Microsoft Excel. Click the image to zoom. Open full-size image
Figures from the sample workbook
| Measure | Actual | Budget |
|---|---|---|
| SG&A payroll | 944.94 | 944.94 |
| Marketing | 240.27 | 228.74 |
| Outbound freight | 106.28 | 111.80 |
| Office and services | 345.42 | 338.52 |
| Total cash SG&A | 1,636.92 | 1,624.00 |
THB thousands · Payroll below excludes factory payroll
Reading order
- Start with total spending versus budget, then investigate departments or categories with material variances.
- Read FTE and payroll per FTE together to distinguish staffing changes from wage rates and employer costs.
- Ask whether higher spending supports more business activity or needs tighter control, using operating results as evidence.
Reading the figures in a worked case
Actual cash SG&A of about THB 1.637m is approximately THB 12,922, or 0.80%, above budget. The arithmetic variance is positive, but the spending variance is unfavourable.
How it is calculated, in plain language
Factory payroll flows into production cost and inventory, so do not add it again to SG&A. Workforce payroll is shown in full THB, and the example assumes full-month employment.
See this number → check what → weigh which decision
Example cases from the synthetic August 2026 data. Every figure comes from the same Excel dataset; the interpretation is a starting point, not a business conclusion.
- You see
Total spend is THB 12.92k (0.80%) over budget, but marketing alone is THB 11.53k over while freight is THB 5.52k under
- Check next
The total hides two opposite stories: freight fell with lower sales volume (see report 03) while marketing rose although sales missed target. Select the Sales department in F7 and read the monthly pattern to see if it is one-off or persistent.
- Decision to weigh
How the return on the extra marketing spend will be judged, and what evidence the budget owner must show before next month's spend is approved.
- You see
SG&A payroll is exactly on budget at THB 944.94k for 26 FTE, about THB 36,344 per person
- Check next
It is on budget because the demo assumes full-month employment and no bonus. With real data, check the Workforce sheet for vacancies, mid-month joiners and leavers, or overtime that push payroll per FTE away from the base rate.
- Decision to weigh
Whether a saving from an unfilled role should be kept or the hire accelerated, and what that means for sales or service.
- You see
Factory headcount of 34 with THB 933.5k payroll does not appear in the SG&A table at all
- Check next
Nothing is missing: factory payroll is allocated into production cost and inventory under the model policy, so it hits profit when goods are sold. See the Production sheet in report 06 for the same amount inside unit cost.
- Decision to weigh
Whether output per factory employee should be reviewed now that volume fell, and who owns the factory staffing decision.
Core calculations in the workbook
| Measure | Definition |
|---|---|
| Payroll | Paid FTE × monthly base pay × (1 + employer burden) |
| Cost per FTE | Payroll / paid FTE; n.a. for zero FTE |
| OPEX variance | Actual OPEX − budget OPEX; positive means over budget |
How to use this report in the workbook
Purpose
Control department spending and explain payroll movements alongside paid FTE.
The filter
The main table uses the department selector in F7. The department comparison chart and Workforce table show all departments to preserve the company context.
Factory cost treatment
Factory payroll is a production input and is excluded from the SG&A table. It remains visible in Workforce. Zero factory SG&A is intentional in this demo.
Headcount data
All demonstration employees work full time for the full month. Before real use, supply paid FTE, join/leave dates, vacancies, bonuses and employer contributions as applicable.
Payroll units
Workforce payroll is in full THB; the main OPEX table uses the selected divisor. Employer burden is already included, so do not add it twice.
Reading and editing essentials
- Always check the company, reporting period and currency scale. A displayed value of 1,000 in a THB-thousands table means THB 1,000,000.
- Actual means recorded results, Budget means plan, and Forecast means estimate. Do not describe a forecast as an achieved result.
- The usual arithmetic variance is Actual minus Budget. Higher revenue or profit is generally favourable; higher costs require investigation of overspending and activity levels.
- Revenue and profit are flows that can be summed across months. Cash, receivables and inventory are balances measured at a particular date.
- Calculate aggregate margin as total profit divided by total revenue. A value of n.a. means a ratio cannot be calculated under the applicable conditions; it should not be replaced with zero without justification.
- Thai and English workbooks are independent files. Editing one does not update the other. Choose a working master, retain backups and refresh related files consistently.
- Before using company data, reconcile the accounts and check dates, version names and formula ranges. Adding rows or months may require extending formulas, charts and controls.
- Read the Checks sheet, but do not treat OK as assurance over everything. Source coverage controls focus on the selected actual month; budget and forecast coverage also need review.
- All data is illustrative. Adapt costing, tax, calendar and funding policies to the business. The pack is a starting point for management reporting.
Related workbook
04_OPEX_and_Workforce_EN.xlsx
Main sheet OPEX Review / ค่าใช้จ่าย · Sources OPEX_Data + HC_Data + PL_Data · The workbook and Markdown guide are in the Excel pack
Use your browser’s print command to save this page as a PDF.

