
Forecast & Outlook
An integrated model connects sales, production, inventory, profit and cash, with Base, Upside and Downside cases.
The report as it appears in Excel
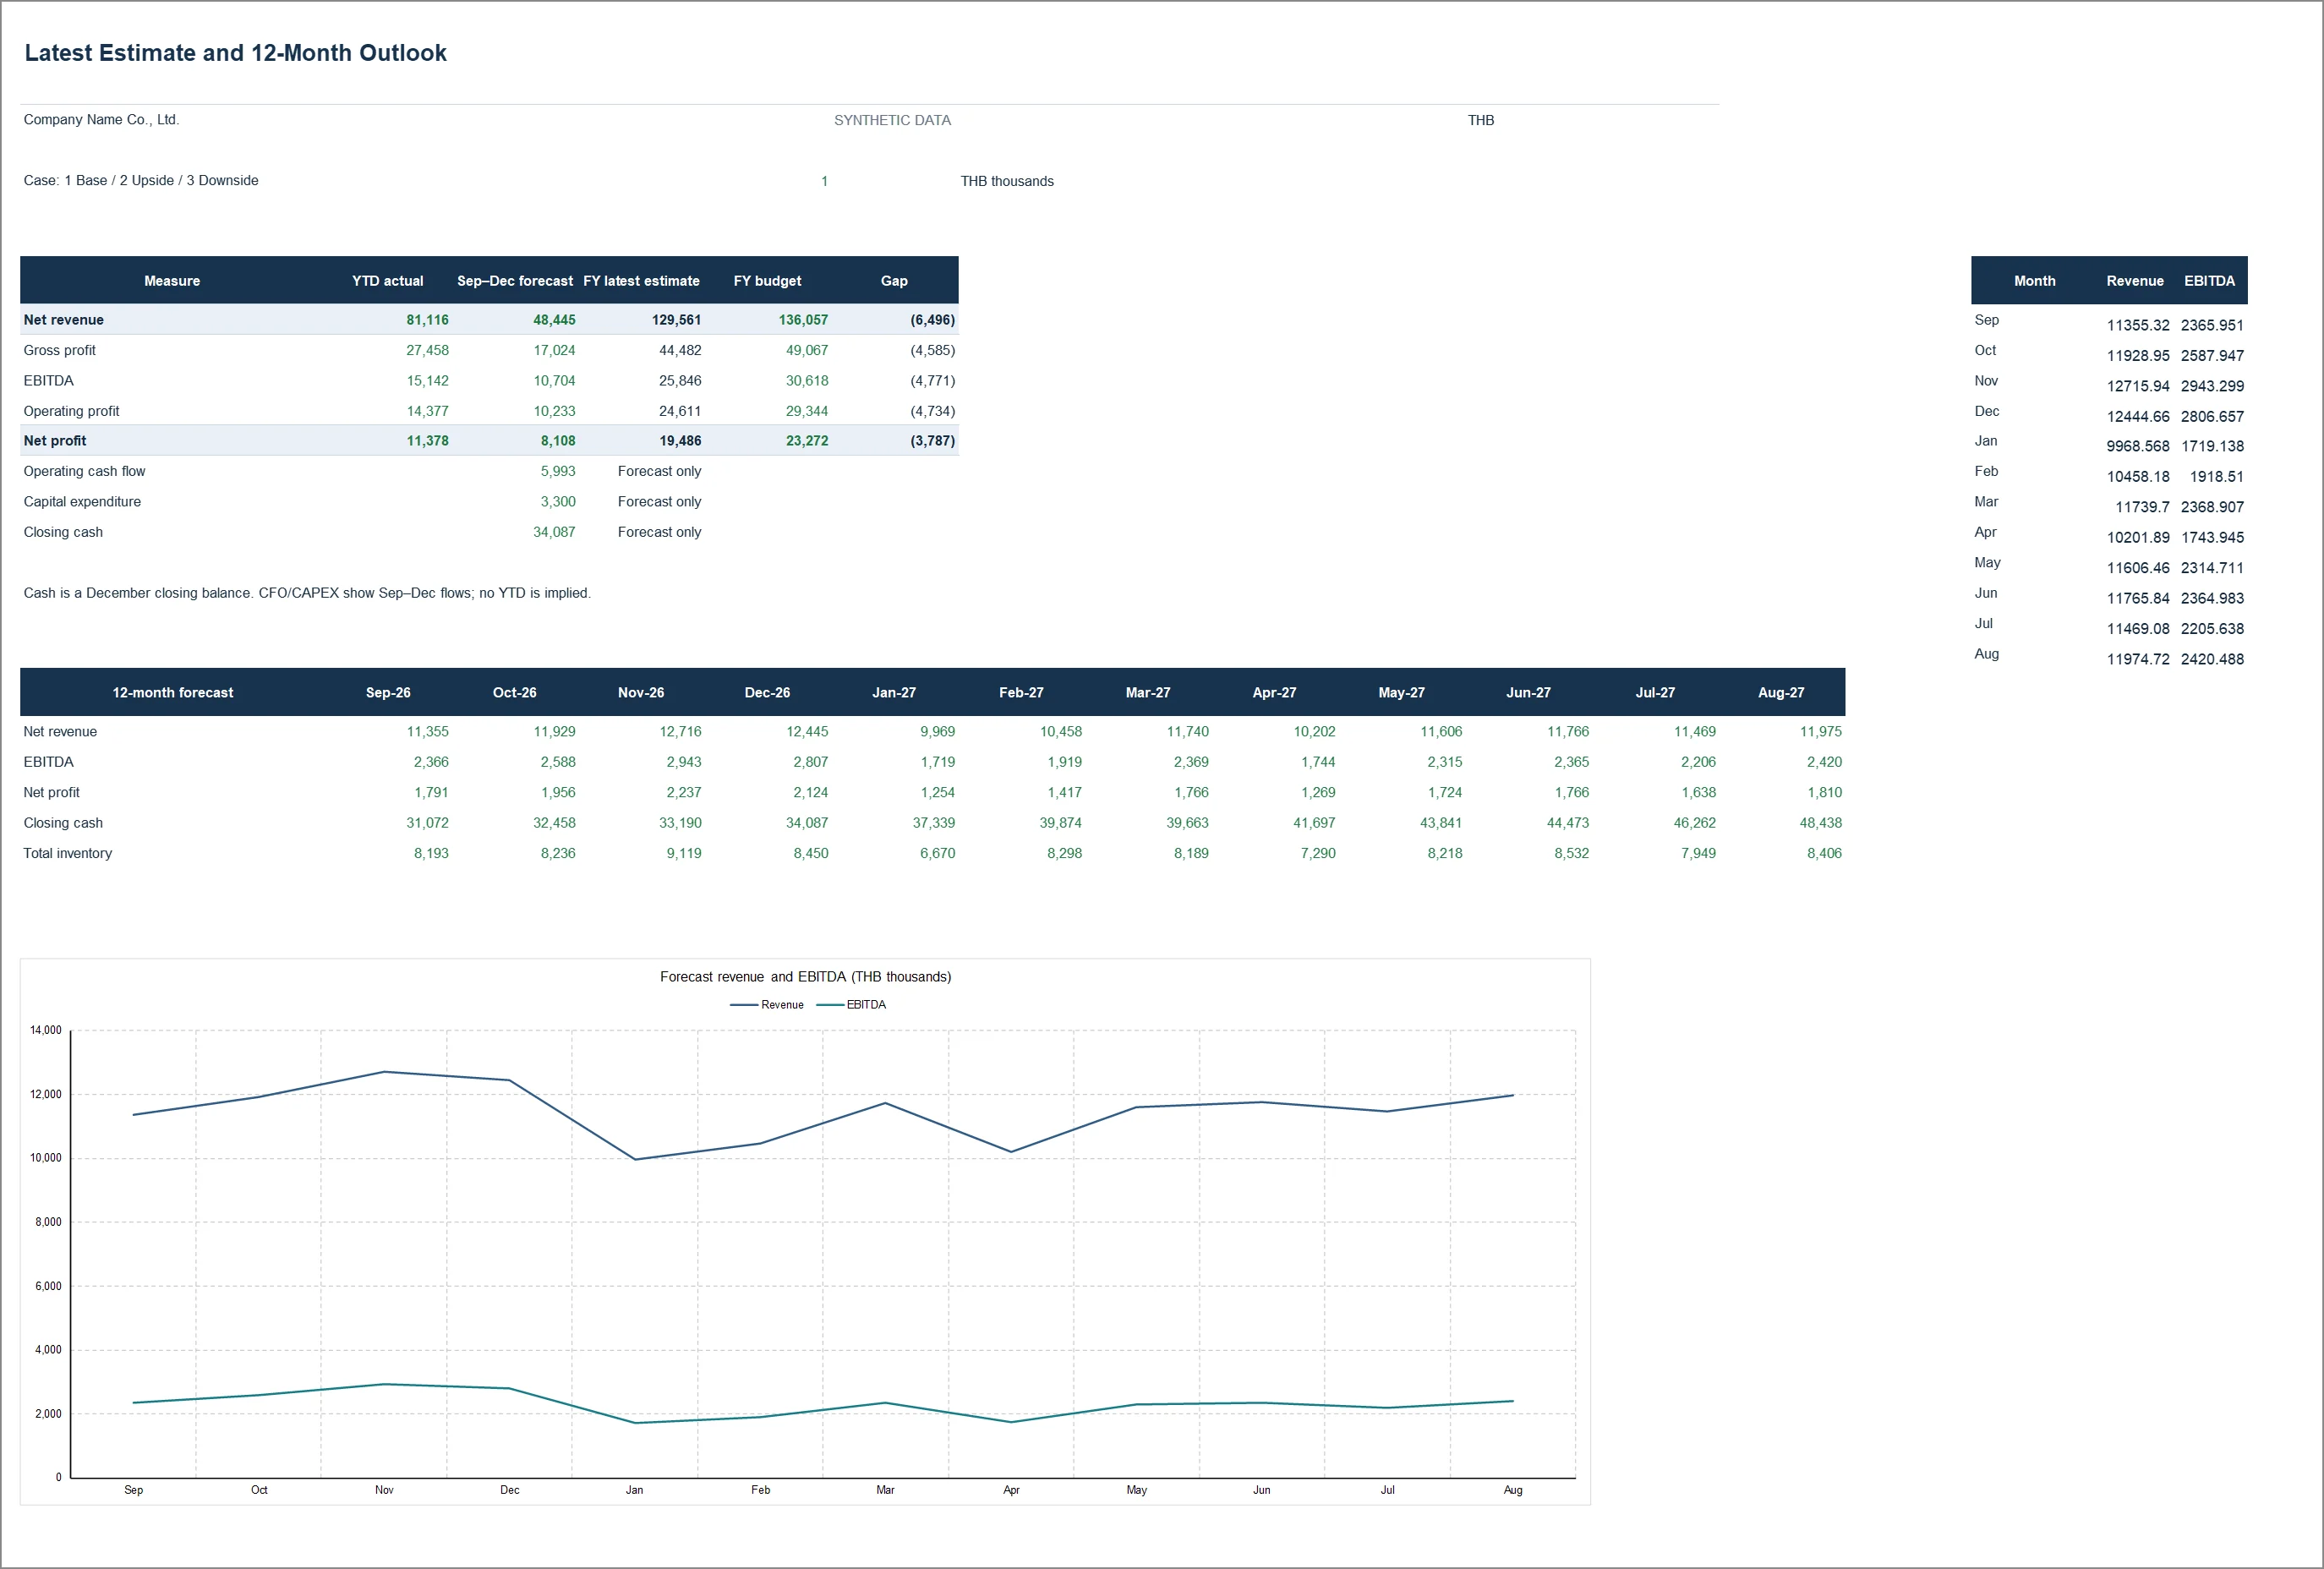
Captured from 05_Forecast_and_Outlook_EN.xlsx, sheet Outlook, after recalculation in Microsoft Excel. Click the image to zoom. Open full-size image
Figures from the sample workbook
| Measure | Amount | Period |
|---|---|---|
| Full-year revenue | 129.6 | FY 2026 |
| EBITDA | 25.8 | FY 2026 |
| Full-year net profit | 19.5 | FY 2026 |
| Year-end cash | 34.087 | End of Dec |
THB millions · Full-year P&L combines Jan–Aug actuals and Sep–Dec forecasts
Reading order
- Reconcile opening balances to August actuals, then select the required case in Assumptions.
- Update drivers such as volume, price, costs, collection days and inventory days, with support for each assumption.
- Review profit together with cash and the balance sheet. Check production, purchasing and funding feasibility before approving the plan.
Reading the figures in a worked case
The base case shows approximately THB 129.6m of 2026 revenue and THB 34.087m of December closing cash. Revenue is a full-year flow; cash is a balance at a point in time.
How it is calculated, in plain language
The live horizon is 12 months, Sep 2026–Aug 2027, despite 24 months of driver inputs. Summary CFO and CAPEX cover Sep–Dec only, not the full year. The model does not automatically borrow to fund a cash deficit.
See this number → check what → weigh which decision
Example cases from the synthetic August 2026 data. Every figure comes from the same Excel dataset; the interpretation is a starting point, not a business conclusion.
- You see
December closing cash: Base THB 34.087m, Upside THB 36.016m, Downside THB 27.784m
- Check next
Switch F6 on Assumptions to 3 and note the downside leaves cash below August's THB 30.634m even with the THB 1.8m September drawdown. Check whether inventory rising to THB 9.367m in that case is realistic when sales fall.
- Decision to weigh
What minimum cash and early-warning trigger to set, and whether to arrange a standby facility before a downside happens rather than after.
- You see
The summary shows THB 5.993m operating cash flow and THB 3.3m CAPEX
- Check next
Both figures cover Sep–Dec only, unlike revenue and profit in the same table which are full year. Read the Financial Model columns D:O for the monthly view, and report 07 for which assets make up the CAPEX.
- Decision to weigh
Which time frame to present cash in so that it is not misread, and which investment could be deferred if the downside materialises.
- You see
Drivers run to Aug 2028 but results stop at Aug 2027
- Check next
Only the 12 live columns D:O calculate; the second 12 months of drivers are unused. A second year needs the Operating Model, Financial Model and summary ranges extended as the guide describes, not just more inputs.
- Decision to weigh
Whether a genuine 24-month outlook is needed, and who owns extending and re-testing the model before it is relied on.
Core calculations in the workbook
| Measure | Definition |
|---|---|
| Production / purchases | Sales units + closing units − opening units |
| Weighted-average cost | (Opening stock value + receipts cost) / (opening units + received units) |
| Operating cash flow | Net profit + incurred D&A − change in AR − change in inventory + change in AP |
| Closing cash | Opening cash + CFO − CAPEX + debt draw − repayment − dividend |
| Retained earnings | Opening retained earnings + net profit − dividends |
How to use this report in the workbook
Purpose
Produce one integrated driver-based forecast linking sales, manufacturing, inventory, P&L, working capital, cash, debt and equity.
Selecting a case
Assumptions F6 selects 1 Base, 2 Upside or 3 Downside. Active drivers are rows 10–53. Editable input blocks start at 71, 132 and 193 respectively.
The calculation horizon
The live calculation horizon is Sep 2026–Aug 2027, columns D:O. Driver inputs extend to Aug 2028, D:AA; the extra driver months do not extend model calculations automatically.
Opening balances
Opening uses reconciled Aug 2026 stocks and balance-sheet balances. Change all opening items consistently; never plug cash or equity to hide a mismatch.
Assets and depreciation
Asset in-service dates drive cash CAPEX, depreciation and fixed assets. Existing opening fixed assets must agree to the asset register. Cost is paid in the in-service month in this example.
The outlook summary
FY P&L = Jan–Aug actual + Sep–Dec forecast. Cash is December closing cash. CFO and CAPEX on the top table show Sep–Dec only, explicitly not a full-year total.
Switching cases
Case selection runs the same formula build. No stale captured scenario matrix is presented. Historical source actuals do not change when a scenario changes.
Model boundaries
Large adverse volume or stock changes can imply negative purchases/production or cash. Review feasibility, repayment versus debt, and funding needs; the model does not insert a financing plug.
Reading and editing essentials
- Always check the company, reporting period and currency scale. A displayed value of 1,000 in a THB-thousands table means THB 1,000,000.
- Actual means recorded results, Budget means plan, and Forecast means estimate. Do not describe a forecast as an achieved result.
- The usual arithmetic variance is Actual minus Budget. Higher revenue or profit is generally favourable; higher costs require investigation of overspending and activity levels.
- Revenue and profit are flows that can be summed across months. Cash, receivables and inventory are balances measured at a particular date.
- Calculate aggregate margin as total profit divided by total revenue. A value of n.a. means a ratio cannot be calculated under the applicable conditions; it should not be replaced with zero without justification.
- Thai and English workbooks are independent files. Editing one does not update the other. Choose a working master, retain backups and refresh related files consistently.
- Before using company data, reconcile the accounts and check dates, version names and formula ranges. Adding rows or months may require extending formulas, charts and controls.
- Read the Checks sheet, but do not treat OK as assurance over everything. Source coverage controls focus on the selected actual month; budget and forecast coverage also need review.
- All data is illustrative. Adapt costing, tax, calendar and funding policies to the business. The pack is a starting point for management reporting.
Related workbook
05_Forecast_and_Outlook_EN.xlsx
Main sheet Outlook / ประมาณการ · Sources Assumptions + Opening + Assets + PL_Data · The workbook and Markdown guide are in the Excel pack
Use your browser’s print command to save this page as a PDF.

