
Department budgets and group consolidation
Collect bottom-up budgets from three departments, then combine two entities into a same-currency management P&L with auditable intercompany service eliminations.
The advanced reports use a new synthetic dataset. It is not a drop-in replacement for the original pack files, so the figures on this page cannot be compared with reports 01–07 even though the company name and currency are the same. This set also uses cash COGS with depreciation below EBITDA, a different cost definition from the core manufacturing model.
The report as it appears in Excel
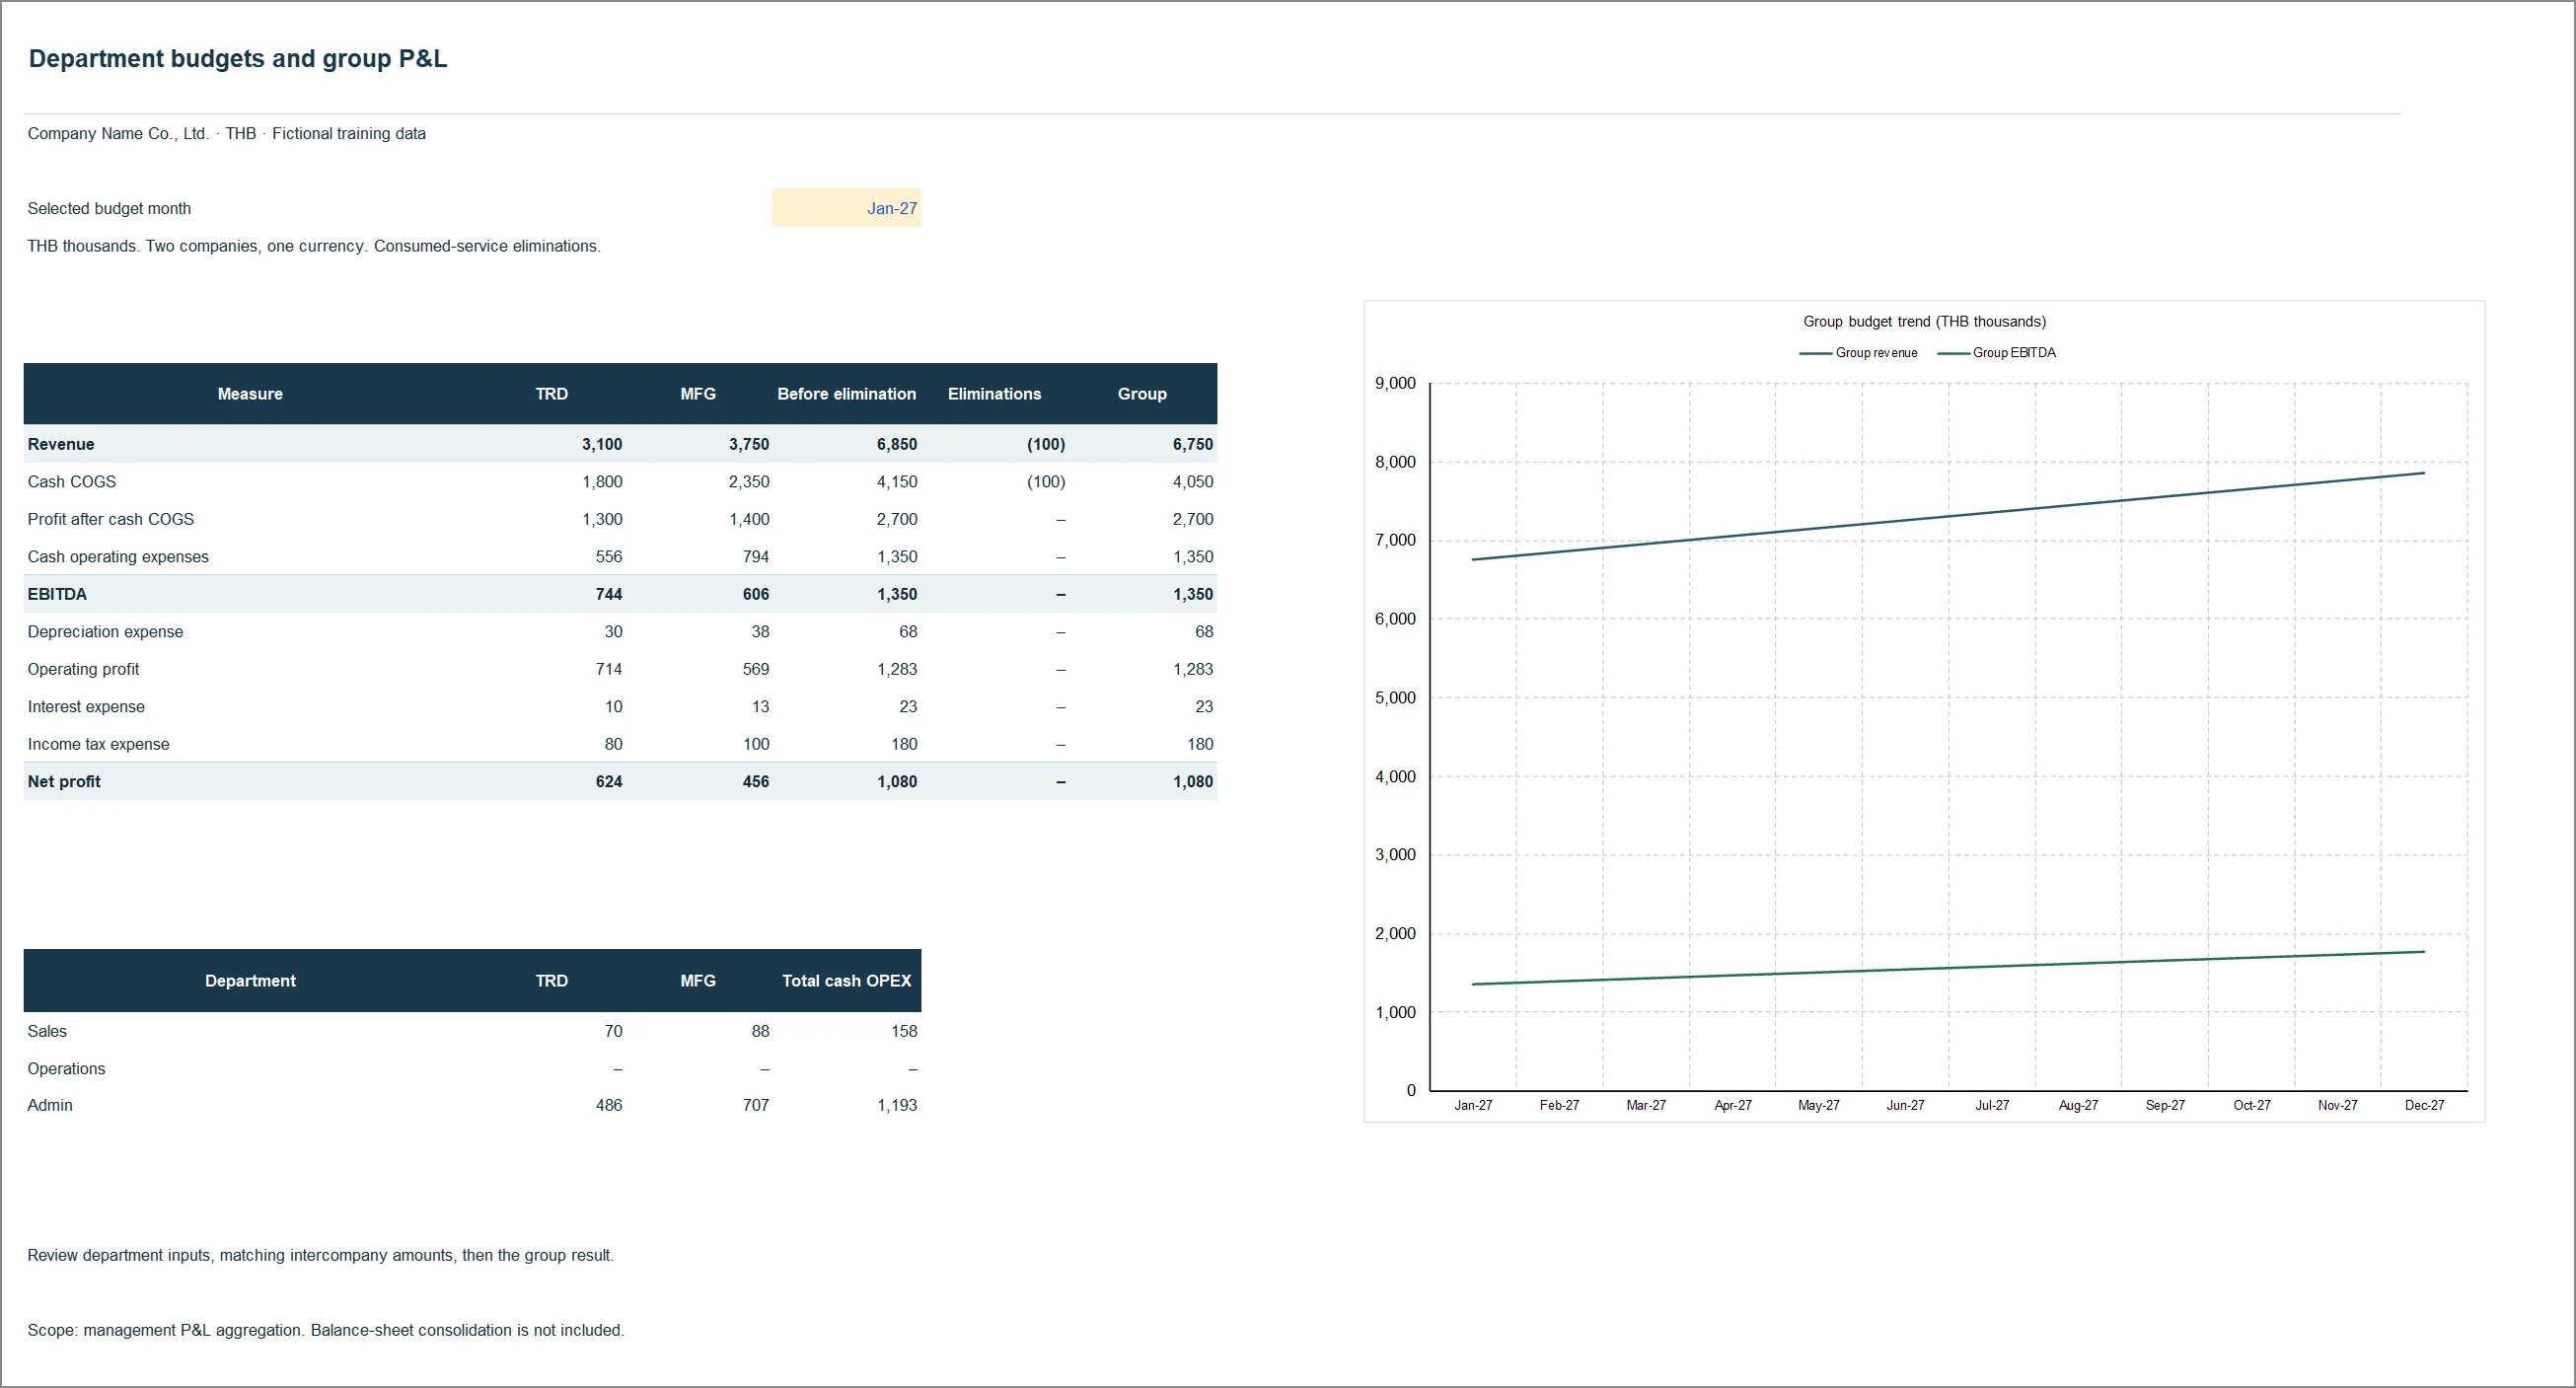
Captured from 10_Department_Budget_Consolidation_EN.xlsx, sheet Summary, after recalculation in Microsoft Excel. Click the image to zoom. Open full-size image
Figures from the sample workbook
| Measure | Before elimination | Eliminations | Group |
|---|---|---|---|
| Revenue | 6,850 | -100 | 6,750 |
| Cash COGS | 4,150 | -100 | 4,050 |
| EBITDA | 1,350 | 0 | 1,350 |
| Net profit | 1,080 | 0 | 1,080 |
THB thousands · Selected budget month January 2027 · Scope is the management P&L; group balance-sheet consolidation is not included
Reading order
- Start with Setup. TRD and MFG are fictional entities, both in THB, and the account mapping assigns revenue, COGS, OPEX, D&A, interest and tax.
- Enter rows in Sales, Operations and Admin with a unique stable RowID, month, entity, account, counterparty, ICRef, units and rate. BudgetAmount = units × rate unless Override is numeric: blank uses the drivers, 0 is an explicit zero budget.
- External rows use counterparty EXT and a blank ICRef. The supported internal demonstration is IC01 between TRD and MFG; match seller and buyer before eliminating anything.
- Enter a balanced journal in Eliminations: debit revenue and credit the consumed internal-service cost. Then choose the month in Summary F6 and review every row on Checks.
Reading the figures in a worked case
In the selected month revenue before elimination is THB 6,850k. Removing THB -100k of internal revenue leaves THB 6,750k for the group, but cash COGS drops by the same THB -100k, so group net profit stays at THB 1,080k. The revenue that disappeared was sold inside the group; no external sale was lost.
How it is calculated, in plain language
The scope is a same-currency management P&L roll-up, not a statutory consolidation. It does not cover group balance sheet and cash flow, foreign currency translation, non-controlling interests, goodwill, acquisitions or unrealised inventory profit. An elimination entry that balances but does not match the actual internal amount still fails the residual intercompany control.
See this number → check what → weigh which decision
Example cases from the synthetic August 2026 data. Every figure comes from the same Excel dataset; the interpretation is a starting point, not a business conclusion.
- You see
Group revenue falls by THB -100k after elimination but net profit stays at THB 1,080k.
- Check next
In the demo TRD sells THB 100,000 of monthly services to MFG, which consumes them, so removing equal revenue and cost lowers both sides at once.
- Decision to weigh
Do not read it as lost external sales. Use the post-elimination figure as the single basis when comparing with group targets, and state the difference in the report each time.
- You see
The two sides of an intercompany balance differ by THB 10,000.
- Check next
Compare both companies for the same service, the same month and the same currency, and establish whether it is a timing difference or a genuine source mismatch.
- Decision to weigh
Agree the source amount with both owners first, then post. Do not book an arbitrary adjustment to force the two sides to agree.
- You see
Admin cash OPEX in the selected month is THB 1,192k, several times the THB 158k of Sales.
- Check next
Separate more paid FTE, a higher cost per FTE and one-off overrides, then read the Notes on that same row.
- Decision to weigh
Confirm with the budget owner before cutting: a supported one-off and a permanently higher run rate call for different decisions.
Core calculations in the workbook
| Measure | Definition |
|---|---|
| Input amount | Numeric override, otherwise units × rate |
| Entity line | Sum of matching period, entity and mapped category from Budget_Fact |
| Pre-elimination | TRD + MFG |
| Journal impact | Net debit = debit − credit; report impact = net debit × mapping sign |
| Group line | Pre-elimination line + elimination impact |
How to use this report in the workbook
Purpose
Use when department owners submit budgets that need aggregation across entities plus simple same-currency intercompany service eliminations. Summary F6 selects the budget month.
How to read
Read the entity columns first, then pre-elimination, then the elimination column, then the group column. Group profit is recomputed from adjusted income and expense; never add or average margin percentages.
Units and scaling
Paid FTE × fully loaded monthly cost works for payroll; units = 1 works for a fixed monthly fee. Convert an annual rate before using it against monthly units. Blank Override uses the drivers; 0 is an explicit zero budget.
Account mapping
Setup C9:F58 maps 50 accounts and I9:K10 configures the two entities. Setup K15:K20 stores the expected monthly row count per entity and department, so a missing submission is detected rather than silently reported as a lower cost.
What is not modelled
This is a management P&L aggregation. Group balance sheet and cash flow, foreign currency translation, non-controlling interests, goodwill, acquisitions and unrealised inventory profit are not included and need their own design.
Reading and editing essentials
- Always check the company, reporting period and currency scale. A displayed value of 1,000 in a THB-thousands table means THB 1,000,000.
- Actual means recorded results, Budget means plan, and Forecast means estimate. Do not describe a forecast as an achieved result.
- The usual arithmetic variance is Actual minus Budget. Higher revenue or profit is generally favourable; higher costs require investigation of overspending and activity levels.
- Revenue and profit are flows that can be summed across months. Cash, receivables and inventory are balances measured at a particular date.
- Calculate aggregate margin as total profit divided by total revenue. A value of n.a. means a ratio cannot be calculated under the applicable conditions; it should not be replaced with zero without justification.
- Thai and English workbooks are independent files. Editing one does not update the other. Choose a working master, retain backups and refresh related files consistently.
- Before using company data, reconcile the accounts and check dates, version names and formula ranges. Adding rows or months may require extending formulas, charts and controls.
- Read the Checks sheet, but do not treat OK as assurance over everything. Source coverage controls focus on the selected actual month; budget and forecast coverage also need review.
- All data is illustrative. Adapt costing, tax, calendar and funding policies to the business. The pack is a starting point for management reporting.
Related workbook
10_Department_Budget_Consolidation_EN.xlsx
Main sheet Summary / Rollup · Sources Sales + Operations + Admin + Eliminations · The workbook and Markdown guide are in the extension pack, which is separate from reports 01–07
Use your browser’s print command to save this page as a PDF.
Common questions
Why do internal transactions have to be eliminated?
Revenue one group company earns from another is not a sale to an outside customer. Left in, it inflates both group revenue and group cost. In the example revenue of THB 6,850k before elimination becomes 6,750k after, while group net profit stays at 1,080k.
Can this file produce statutory consolidated statements?
No. Its scope is a same-currency management P&L. It does not cover the group balance sheet or cash flow, currency translation, non-controlling interests, goodwill or unrealised profit in inventory.
The two sides of an internal balance disagree. What now?
Compare the same service, month and currency in both companies and establish whether it is timing or a wrong source amount. Agree the figure with both owners before posting anything; do not book an adjustment just to make the sides match.

