
Rolling 12-month forecast
Forecast profit, cash, inventory and debt for the twelve months after the last closed month. Change the cutoff and both the window and the opening balances actually move, with three dated scenario cases.
The advanced reports use a new synthetic dataset. It is not a drop-in replacement for the original pack files, so the figures on this page cannot be compared with reports 01–07 even though the company name and currency are the same. This set also uses cash COGS with depreciation below EBITDA, a different cost definition from the core manufacturing model.
The report as it appears in Excel
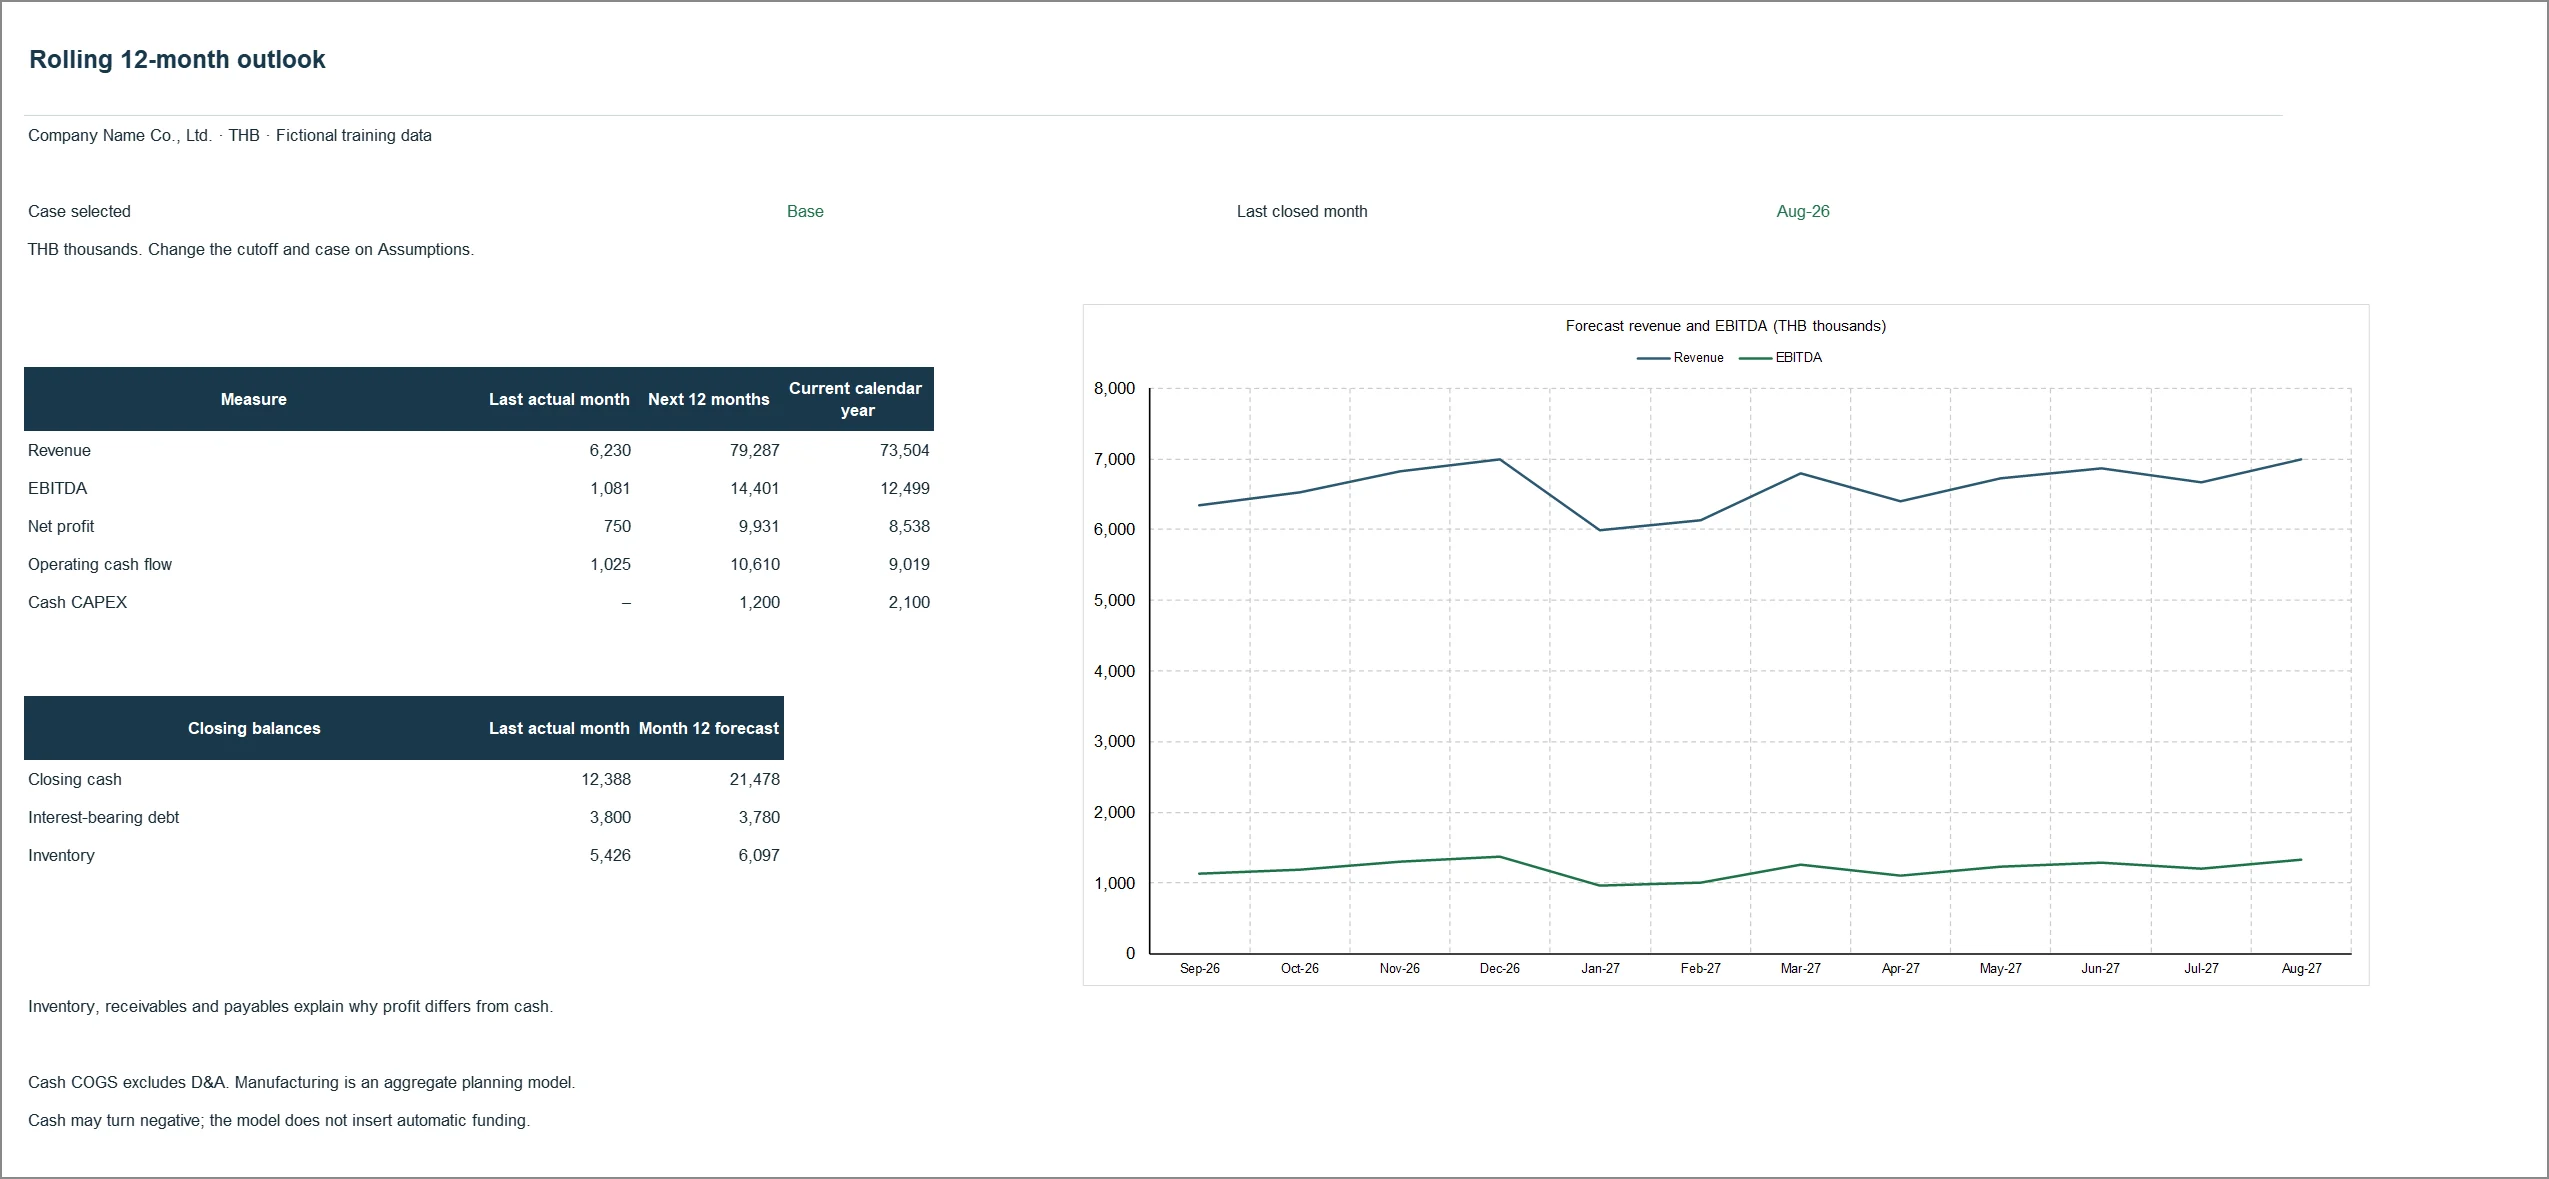
Captured from 09_Rolling_Forecast_EN.xlsx, sheet Summary, after recalculation in Microsoft Excel. Click the image to zoom. Open full-size image
Figures from the sample workbook
| Measure | Next 12 months | Current calendar year |
|---|---|---|
| Revenue | 79,287 | 73,504 |
| EBITDA | 14,401 | 12,499 |
| Net profit | 9,931 | 8,538 |
| Operating cash flow | 10,610 | 9,019 |
THB thousands · Base case, last closed month August 2026 · Closing balances are point-in-time values, not cumulative flows
Reading order
- On Assumptions set F6 to 1 Base, 2 Upside or 3 Downside, and set K6 to the last fully closed month.
- Close the accounts first, then add or replace exactly one complete, non-duplicated Actuals row for the new month and reconcile it to that month closing package.
- Advance K6 and update the dated assumptions across the new horizon. One-off items such as CAPEX and dividends stay on their intended dates; do not slide input values left because the output window moved.
- Read Forecast to trace the calculation, then Summary. Review all twelve monthly Checks, especially negative purchases, cash, debt or net PPE.
Reading the figures in a worked case
The base case gives THB 79,287k of revenue over the next twelve months, THB 14,401k of EBITDA and THB 10,610k of operating cash flow. Month twelve closes at THB 21,478k of cash against THB 12,388k in the last actual month. Revenue and EBITDA are totals for the period; cash is the balance in the final month only.
How it is calculated, in plain language
Assumptions are matched by absolute date, not by a month-one-to-twelve sequence. Editing a price in a case that is not selected changes nothing, and neither does editing a month outside the current twelve-month window. The model also never borrows automatically: negative cash is a funding signal to act on, not an error the file fixes for you.
See this number → check what → weigh which decision
Example cases from the synthetic August 2026 data. Every figure comes from the same Excel dataset; the interpretation is a starting point, not a business conclusion.
- You see
Revenue for the next twelve months is THB 79,287k but operating cash flow is only THB 10,610k, while closing inventory rises to THB 6,097k from THB 5,426k.
- Check next
Check the receivable days and stock cover in the assumptions, then compare the modelled balances with contractual credit terms and actual stock needs.
- Decision to weigh
If the modelled terms exceed the real ones, fix the assumptions first. Do not add a credit line to close a gap the assumptions created.
- You see
Purchases turn negative in one or more months.
- Check next
That means the planned stock reduction exceeds the month cash COGS. Confirm whether the inventory can actually be liquidated as planned.
- Decision to weigh
If a write-down or disposal is needed, add that schedule explicitly. Do not assume an automatic refund from suppliers.
- You see
A price edit is made in the assumptions but month twelve of the report does not move.
- Check next
Check whether the edit landed on that month absolute date column, and whether the edited case is the one selected in F6.
- Decision to weigh
Confirm the date and the case before concluding the model is wrong: editing an inactive case is supposed to leave the active forecast untouched.
Core calculations in the workbook
| Measure | Definition |
|---|---|
| Revenue | Units × selling price by business stream |
| Cash COGS | Units × cash unit cost, excluding D&A |
| EBITDA | Revenue − cash COGS − cash operating expenses |
| Interest | Opening monthly debt × annual rate ÷ 12 |
| Working capital | AR = revenue × DSO ÷ calendar days; inventory = cash COGS × DIO ÷ calendar days |
| Purchases | Cash COGS + closing inventory − opening inventory |
How to use this report in the workbook
Purpose
Use when the forward horizon must move after each close. Assumptions K6 is the last fully closed month; changing it moves both the twelve-month window and the opening balances taken from that actual month.
Selecting a case
F6 selects 1 Base, 2 Upside or 3 Downside. Each driver has one active formula row above three editable case rows; edit the case rows, never the active row. Editing an inactive case must not change the active forecast.
The calculation horizon
Dated driver columns run January 2026 to December 2028 and are matched by absolute date, not by position in the window. One-off CAPEX and dividends stay on their intended dates when the cutoff advances.
Opening balances
Actuals A9:U108 takes up to 100 monthly rows of flows and closing balances, not YTD P&L. The demo actuals end in August 2026; a later cutoff needs a complete new actual row first, reconciled to that month closing package.
Model boundaries
Manufacturing uses aggregate cash unit costs and inventory cover, not BOM, WIP, capacity or standard-cost variances. Interest on new monthly debt starts the following month. There is no VAT timing, FX, lease or automatic financing.
Reading and editing essentials
- Always check the company, reporting period and currency scale. A displayed value of 1,000 in a THB-thousands table means THB 1,000,000.
- Actual means recorded results, Budget means plan, and Forecast means estimate. Do not describe a forecast as an achieved result.
- The usual arithmetic variance is Actual minus Budget. Higher revenue or profit is generally favourable; higher costs require investigation of overspending and activity levels.
- Revenue and profit are flows that can be summed across months. Cash, receivables and inventory are balances measured at a particular date.
- Calculate aggregate margin as total profit divided by total revenue. A value of n.a. means a ratio cannot be calculated under the applicable conditions; it should not be replaced with zero without justification.
- Thai and English workbooks are independent files. Editing one does not update the other. Choose a working master, retain backups and refresh related files consistently.
- Before using company data, reconcile the accounts and check dates, version names and formula ranges. Adding rows or months may require extending formulas, charts and controls.
- Read the Checks sheet, but do not treat OK as assurance over everything. Source coverage controls focus on the selected actual month; budget and forecast coverage also need review.
- All data is illustrative. Adapt costing, tax, calendar and funding policies to the business. The pack is a starting point for management reporting.
Related workbook
09_Rolling_Forecast_EN.xlsx
Main sheet Summary / Forecast · Sources Actuals + Assumptions · The workbook and Markdown guide are in the extension pack, which is separate from reports 01–07
Use your browser’s print command to save this page as a PDF.

